
SECTIONS

Flaring is one of the most visible forms of waste at upstream and downstream oil and gas facilities. Capturing flare gas not only has environmental benefits; it has economic incentives as well.
Efforts by petroleum and natural gas production facilities to reduce greenhouse gas (GHG) emissions have intensified over recent years to meet growing demands from companies, governmental institutions, and the public. The “Zero Routine Flaring by 2030” initiative was launched by the World Bank and the United Nations (UN) in 2015 with the goal of eliminating routine flaring in upstream facilities by 2030 (1). Several major companies in the industry have already made this pledge.
This article discusses the impact of flaring in upstream and downstream oil and gas facilities. Technologies to reduce flaring in upstream production and downstream refining and petrochemical plants — including flare gas recovery systems, the use of instrumentation, and rerouting of relief streams — will be reviewed.
Introduction
Industrial GHG emissions represent the third-largest source of GHG emissions in the U.S., with only transportation and electricity contributing higher emissions (2). GHG emissions reported by the upstream petroleum and natural gas industry in 2020 (down 9% from 2019) amount to carbon dioxide emissions of 234 million m.t., methane emissions of 82 million m.t. CO2e, and nitrous oxide emissions of 0.2 million m.t. CO2e (3). The downstream refinery sector in 2020 (down 10% from 2019) reported carbon dioxide emissions of 160 million m.t., methane emissions of 0.8 million m.t. CO2e, and nitrous oxide emissions of 0.5 million m.t. CO2e (4). The combined GHG emissions from upstream and downstream oil and gas contribute 32% of the total emissions from the industrial sector, with the majority of that from sources other than flares. While gas flaring may contribute only a fraction of the total industrial GHG emissions, routine flaring can be more easily eliminated than other sources of industrial emissions. Additionally, the natural gas that is flared is a useful energy resource that produces less emissions than alternative fuels.
Flaring in petroleum and natural gas production and refining
Environmental impact. In the combined upstream and midstream systems (e.g., onshore and offshore production, gathering, boosting, natural gas processing, natural gas transmission and distribution, and liquefied natural gas [LNG]), flaring accounts for 11% of the total emissions from these facilities in the U.S. Flaring and venting at onshore production facilities accounts for 20% of its emissions, and flaring and venting at offshore production facilities accounts for 26% of its emissions. In Texas, flaring of natural gas from oil producers is nearly equivalent to all of the state’s residential consumption (5).
In 2020, surveys conducted by the Permian Methane Analysis Project found combustion issues caused high methane emissions in 10% of flares on average, with half of those being completely unlit and venting (6). This is a problem because methane is 25 times more potent than carbon dioxide as a GHG, and a small amount of vented unburned methane can make flared gas significantly more hazardous for the environment.
In addition, Texas A&M researchers found vented and flared gas volumes from the Texas Permian Basin and the Eagle Ford Shale from 2012–2015 reported to the Texas Railroad Commission to be only half of the observed gas flaring volumes from National Oceanic and Atmospheric Administration (NOAA) estimates that use satellite observations (7). Discrepancies could be caused by errors in reporting, errors in satellite estimates (NOAA claims accuracy within 9.5%), and flaring from flares that are exempt from being reported. Changes to flare burning efficiency can also cause discrepancies in the satellite estimates that have been calibrated against flared gas volumes self-reported by oil producers. These reported volumes may include vented methane that remained unburned by the flare.
Texas A&M studies in two regions of the Eagle Ford Shale also found that flaring may be the major source of nitrogen oxide in the rural area, which causes acid rain, ozone, and smog. The International Energy Agency (IEA) estimates the average global combustion efficiency of flares, including those that are unlit, to be around 92% (8).
The World Bank estimated that flaring of natural gas contributed about 400 million m.t. of the 37 billion m.t. of global carbon dioxide emissions from the combustion of fossil fuels in 2018. While gas flaring represents only 1% of the total global carbon dioxide emissions, it can be mitigated more easily than other carbon dioxide emissions, such as those from the combustion of fuel. Furthermore, the gas has valuable use as fuel and can replace other sources of fuel that have higher emissions, such as coal and diesel (1).
Economic impact. A report from the Institute for Energy Economics and Financial Analysis found that in 2018, oil producers in the Permian Basin flared and vented 238 billion ft3 of natural gas worth $750 million (9). The lack of pipelines and infrastructure to transport the gas is the primary reason that oil companies obtained permits from the Texas Railroad Commission to burn the gas on-site. The World Bank estimates that the 5,014 billion ft3 of natural gas flared globally every year could power the entire sub-Saharan Africa (10) and, according to the IEA, it could meet the natural gas demand of Central and South America (8). Oil fields are often in remote locations and are difficult to access. Further, production sites can be small and spread out over large geographical areas, making it extremely cost-prohibitive to develop infrastructure to get the gas to processing facilities and finally to market.
Flaring in downstream refineries. Although the refinery sector is the fourth-largest contributor of GHG emissions in the industrial sector in the U.S., it is the second-highest on a per-facility basis, behind power plants. However, the fraction of refinery emissions that come from flaring is relatively low at 2% (Table 1). Emissions from stationary fuel combustion, which are reported under the U.S. Environmental Protection Agency (EPA) Greenhouse Gas Reporting Program Subpart C, dominate refinery emissions at 72% (3, 4). Combustion sources include steam boilers, process furnaces, and process heaters. Catalytic cracking and reforming contribute the second-highest GHG emissions at refineries at 24%. While the carbon capture technology for the largest sources of CO2 in refineries is not currently ripe enough to provide economic incentive, installation of flare gas recovery systems over the last 15 years have provided economic incentive while also reducing GHG emissions.
| Table 1. The U.S. Environmental Protection Agency (EPA) provides greenhouse gas reporting program data for upstream and downstream oil and gas. Shown here is data from 2020 (3, 4). | ||||||
| Total Petroleum and Natural Gas Production | Onshore Production | Offshore Production | Gathering and Boosting | Natural Gas Processing | Refinery | |
| Number of Facilities | 2,377 | 468 | 134 | 361 | 462 | 140 |
| Total Emissions, million m.t. CO2e | 316 | 93.5 | 6.5 | 90 | 59 | 161 |
| Emissions per Facility, million m.t. CO2e | 0.13 | 0.20 | 0.05 | 0.25 | 0.13 | 1.15 |
| Flare and Blowdown Vent Emissions, million m.t. CO2e | 36.0 | 18.0 | 1.7 | 4.0 | 6.5 | 3.2 |
| Flare and Blowdown Vent Emissions per Facility, million m.t. CO2e | 1.51×10⁻² | 3.85×10⁻² | 1.23×10⁻² | 1.11×10⁻² | 1.41×10⁻² | 2.30× 10⁻² |
| % Flare and Blowdown Vent Sources | 11.4% | 19.3% | 25.4% | 4.4% | 11.0% | 2.0% |
To the general public, flaring is one of the most visible forms of waste at refineries and one of the low-hanging fruits for refineries working toward reducing emissions (Figure 1). Flaring, especially when it is accompanied by smoke, draws attention from the public and is prime content for local news reports. Efficient, smokeless flaring is a top priority in the design of the flare.
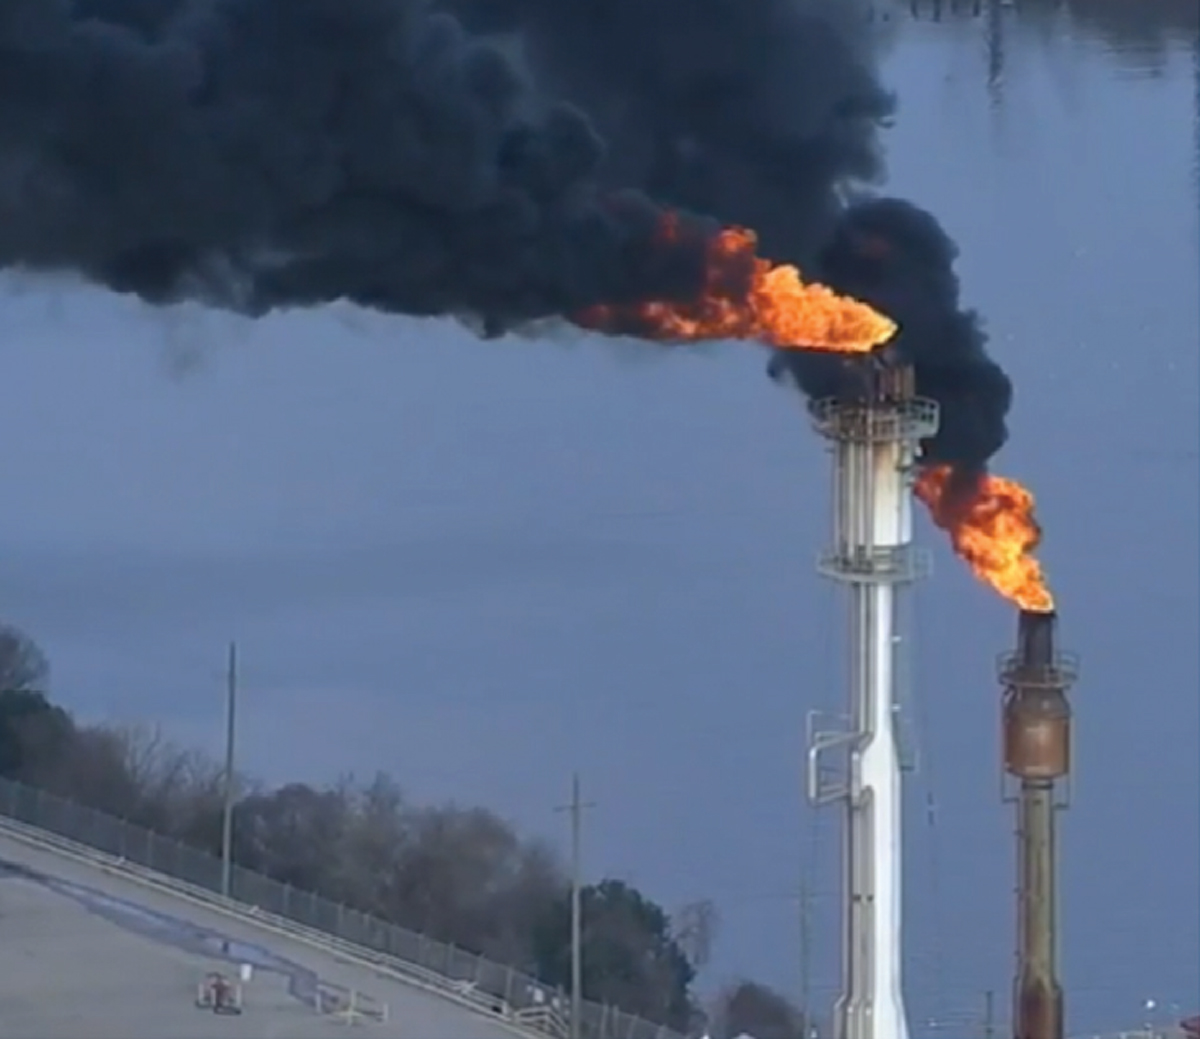
▲Figure 1. Flaring is one of the most visible forms of waste at a refinery. In this photo, a refinery power outage has resulted in a flaring event with smoke visible for miles.
Initiatives to reduce emissions
In the past few decades, oil companies have received scrutiny from governments, politicians, advocacy groups, and the general public. Because of this scrutiny, oil companies have become much more conscious of their impact on the environment. Since 1996, oil production has increased by 19% but flaring has decreased by 14%, as shown in Figure 2 (11).
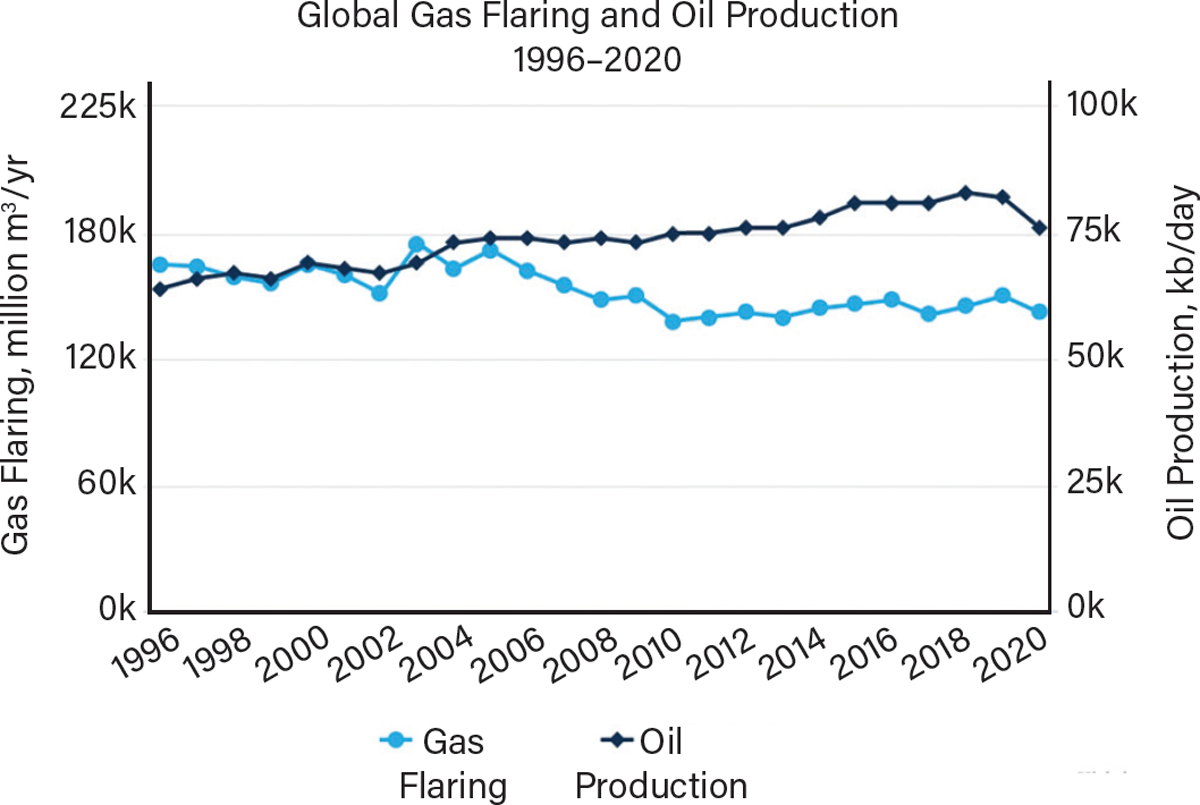
▲Figure 2. While oil production has increased over the past few decades, flaring has decreased (11).
Since the 2015 Paris Climate Agreement, 44 countries and the European Union have pledged to zero net emissions by 2050, with ten of those making their target a legal obligation and another eight proposing to make it a legal obligation (12). The net zero scenario by 2050 requires that all routine flaring, not including emergency flaring, is eliminated by 2030 (Figure 3) (8). While there has been some progress made, much more work needs to be done.
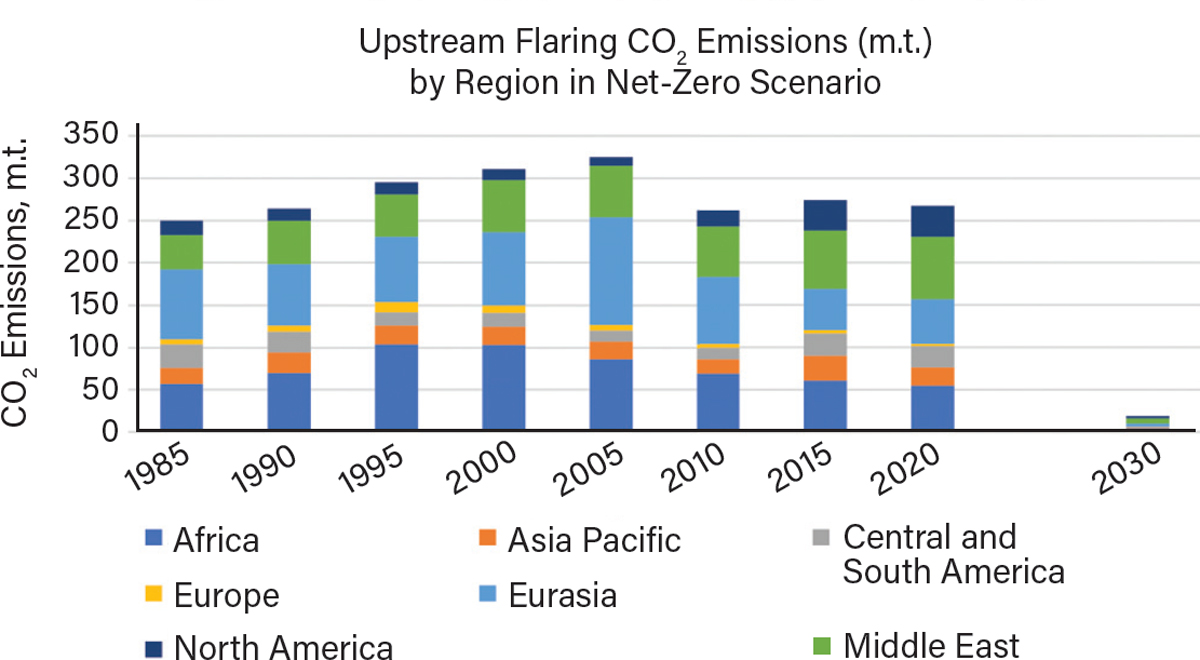
▲Figure 3. To meet the net-zero emissions goals of the Paris Climate Agreement, upstream flaring (not including emergency flaring) will need to be eliminated by 2030 (8).
The World Bank’s Global Gas Flaring Reduction Partnership (GGFR) is a multi-donor trust fund with the purpose of ending routine flaring in oil production sites. GGFR develops flaring reduction programs specific to each country and conducts research, publishes global gas flaring estimates, shares best practices, and raises awareness. A list of participating governments, companies, and multilateral organizations can be found in Ref. 10.
In 2015, GGFR launched the “Zero Routine Flaring by 2030” initiative, which garners public commitments from governments and oil companies to eliminate routine flaring by 2030. The initiative is voluntary and endorsing governments and oil companies report their annual flaring, which is verified using government and company reports, as well as satellite observations. The initiative encourages greenfield projects to develop plans to use the associated gas and reserve flaring for emergency scenarios. For existing production sites, the initiative encourages participants to reduce routine flaring and eliminate it by 2030. Participation in the initiative provides the company or country global recognition as an example for others to follow, provides participants with networking resources, and attracts industry investors. Thirty-four governments, including the U.S., U.K., Saudi Arabia, Russia, Germany, and Canada are official endorsers, in addition to fifty-one oil companies, including BP, Chevron, and Saudi Aramco, as well as 15 developmental institutions. Endorsers of the initiative account for about 60% of total gas flared globally (1).
Other global initiatives include the Oil and Gas Climate Initiative consisting of twelve major international oil and gas companies and the Climate and Clean Air Coalition, which is a voluntary partnership of over 120 governments, businesses, and organizations.
Technologies to minimize flaring upstream
Petroleum wells are often in remote locations that are difficult to access, and sites can be spread out over large geographical areas. Natural gas, which primarily consists of methane, is dissolved in the oil deep underground at high pressures. As the oil is brought to the surface of the earth, some of the natural gas escapes due to the reduction in pressure. This natural gas is known as associated gas and is typically flared if there is no economically viable use for the gas. The scale and consistency of this natural gas rate can vary greatly, and the closer the reservoir is geographically to a market demand and the more consistent the flowrates, then the more viable and economically feasible it is to build the pipelines necessary to get the gas to market.
According to the IEA, flare gas recovery technologies are economically feasible when the volume of gas is greater than 10,000 m3 per day and the field is within 2,000 km from the closest viable market. When the site meets these criteria, it is viable to use the gas for electrical power generation or transmit it to market via pipelines. The agency recommends that when the site does not meet these criteria, government incentives should be employed to control gas flaring. Flare gas utilization technologies such as LNG and liquefying and transporting using tankers may be other viable options (13).
Several studies have compared the different technologies and although it can be difficult to determine the best option, major factors that should be considered include volume of gas, distance to market, and market price. In this section, several methods of flare gas reduction technologies are described, as first outlined in Ref. 13.
Gas reinjection. Gas reinjection was first developed in the U.S. and has become very successful over the past two decades. As oil is removed from the reservoir, pressure in the reservoir drops over time, making it more difficult to extract the oil. Reinjecting gas that would have previously been flared back into the reservoir (called pressure maintenance) increases the pressure to drive the oil to the surface and therefore increases production. This technology is viable for all types of oil fields, even remotely isolated and small-scale ones.
Electricity. When the oil field is connected to an existing electrical grid, gas-to-power technology can be used to generate electricity and send it to the power grid. When the oil field is not connected to an existing electrical grid, electricity can be generated to power the oil field operations or it can be sent to rural areas where there is currently no electricity.
Compressed natural gas (CNG). CNG seems to be a promising technology for oil fields in remote locations with low natural gas volumes. The technology allows for flexibility because the natural gas can be compressed into trucks on an as-needed basis and thus it is unnecessary to construct pipelines or LNG plants. There is currently no technology available for CNG transport via sea, but its development could be an option for offshore oil production sites with small and sporadic associated gas volumes (13).
Liquefied petroleum gas (LPG). LPG has successfully been used in Russia to minimize flaring in midsize oil fields. LPG technology is a viable option when the associated gas or the natural gas field has relatively high propane and butane concentrations (e.g., higher than 15%) (13). LPG units that compress gas and condense out the heavier propane and butane components are commercially developed and can be controlled remotely. The LPG can also be easily stored and transported.
Liquefied natural gas. LNG involves the condensing of natural gas into liquid phase at extremely low temperatures, making it easier to transport as compared to the gaseous phase. LNG technology has been around since the 1970s and delivers natural gas as feedstock to the chemical industry and as fuel source for power plants. LNG plants have higher capital costs and construction time than CNG, but have higher transport capacity and may be advantageous when transporting across long distances (13).
Technologies to minimize flaring in refineries
Flare gas reduction in refineries often involves flare gas recovery compressors that recover the gas upstream of the seal drum and send it to the refinery’s fuel gas system. Today, refineries are also installing commercially available on-site co-generation units that use the fuel gas for both power generation and steam generation. This unit takes advantage of the waste heat from the natural gas turbine, which combusts the natural gas to create high-pressure and high-velocity gas, to generate steam that is used in processes throughout the refinery.
Flare gas recovery systems have gained traction in refineries over the past couple of decades because the savings in fuel and steam consumption quickly pay for the initial capital costs and greatly outweigh the yearly maintenance costs. A basic setup for a flare gas recovery system is shown in Figure 4.
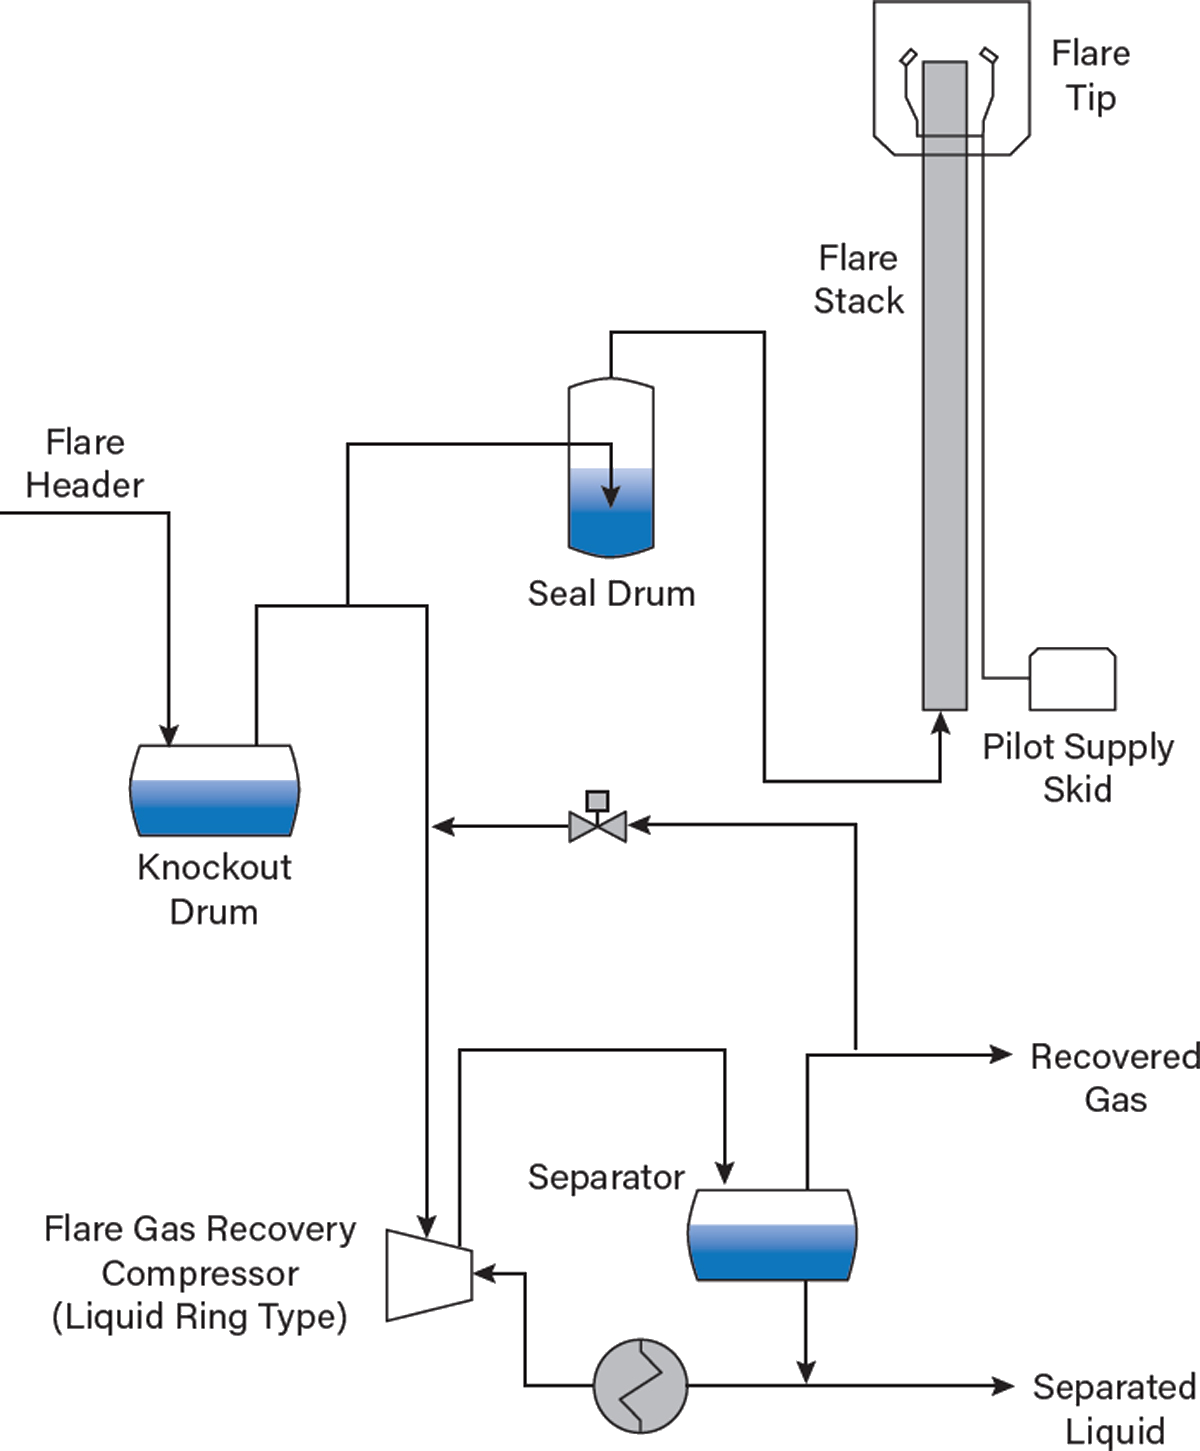
▲Figure 4. Refineries commonly recover flare gas using a liquid-ring-type compressor.
Flare gas recovery compressor. The most commonly used type of flare gas recovery compressor is the liquid ring compressor. This type of compressor works by using a “ring” of liquid, usually water, rotating inside the casing along with rotor blades. The shaft is positioned such that with each revolution of a rotor blade, the space between two rotor blades is filled with liquid and, as it turns, the liquid moves out toward the casing walls and creates a vapor chamber.
The gas enters through the inlet port into vapor chambers between the rotors and the liquid seal. As the rotors turn, the gas within each chamber is compressed as the liquid seal once again fills more of the vapor chamber. The compressed gas exits through the exhaust port. This principle is similar to that of a piston compressor, where the piston moves away from the intake to pull in gas then moves in the opposite direction to compress the gas. Liquid ring compressors are popular for flare gas recovery systems because they:
- can intake and absorb some condensed liquid and solid particulates
- can handle condensate formation in the discharge
- have integral cooling that allows for an isothermal process
- have smooth, pulse-free operation
- can handle a range of compositions
- can operate at low speeds and have relatively low maintenance costs.
One disadvantage of liquid ring compressors is that they operate at relatively low efficiency at lower capacities than other technologies (14). Other options for flare gas recovery compressors include slide vane compressors and reciprocating compressors, which may have their own advantages, such as efficient operation at variable speeds, but also have disadvantages, such as requiring coolers. There has been at least one case where a refinery sent steam to the flare system during startup operations. This steam condensed in the flare gas recovery compressor fin fan cooler and caused a localized vacuum at the suction of the compressor, which triggered the low-pressure shutdown of the compressor.
Seal drum. Seal drums are used in flare systems to create a liquid seal between the flare header and the flare stack to:
- maintain a positive pressure in the flare system to prevent air ingress and to allow the use of a vapor recovery system
- lower the purge gas requirements for the flare stack
- prevent flashback into the flare header system
- provide a method of staging between flare systems
- lower the chance of air ingress caused by vacuum created inside the flare header due to condensation of hot vapors after a major emergency relieving event or after steaming operations.
A seal depth of six inches is common for general purposes but a depth of 30–60 in. is typical when flare gas recovery systems are used to create 1 to 2 psi backpressure for the compressor (15).
Routine flaring. Flare gas recovery systems are not designed for the high flaring rates that occur during emergency flaring scenarios. The purpose of flare gas recovery systems is to minimize routine flaring that is planned and expected to occur during various operations. These include continuous flows such as sweep gas as well as non-continuous flows during routine operations such as startup, shutdown, catalyst regeneration, planned decommissioning, etc. The flare gas typically contains a large amount of methane and other light hydrocarbons. Sending the flare gas to the refinery fuel gas system for processing allows some variations in gas composition, including trace amounts of hydrogen sulfide and carbon dioxide that would be scrubbed out before being sent to fuel gas users.
Example flaring rates for a 100,000-bpd refinery are shown in Figure 5. The data shown is for one of two flare gas recovery systems that services two of its four flares, and the hourly rates span across a timeframe of two months. This flare gas recovery compressor recovered an average of 900 scfm, while the refinery’s other flare gas recovery compressor recovered an average of 230 scfm. Besides a four-hour period in which an emergency event resulted in flaring rates up to 35,000 scfm (not shown in the graph), routine flaring was an average of only 30 scfm from this flare, meaning 97% of the routine flare gas was recovered.
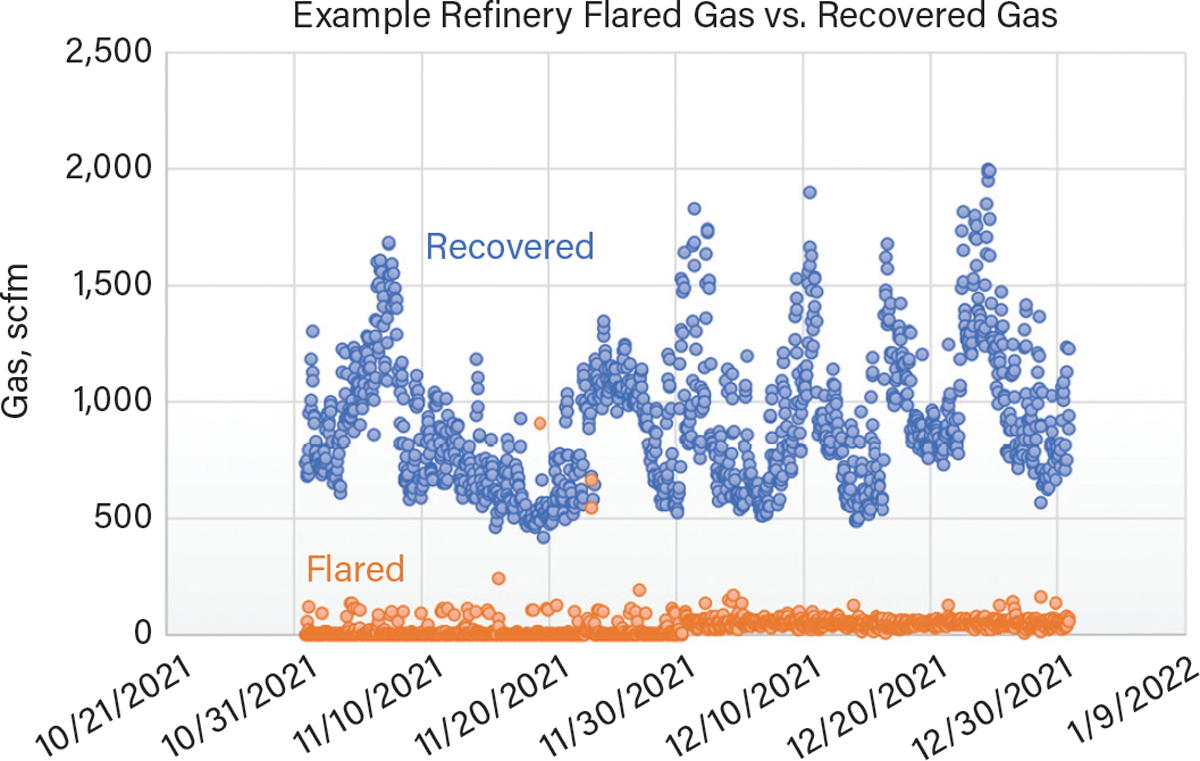
▲Figure 5. This flare gas recovery system was able to capture an average of 900 scfm of flare gas, while an average of only 30 scfm of gas was routinely flared.
The flare gas had an average methane content of 82%, making it suitable to be used in the refinery fuel gas system. Assuming a natural gas cost of $5 per MMBtu and a fuel gas savings of 1,130 scfm or 1,695 MMBtu/day, this refinery would save $3,000,000 every year, minus the initial capital cost and ongoing maintenance costs.
Plant practices. In addition to flare gas recovery systems, improvements in plant practices can help reduce flaring rates. For example, proper equipment maintenance can reduce leakage of gases into the flare header. Operating and maintenance procedures should be reviewed to identify changes to procedures that can minimize waste gases. If there is a normal mode of operation that produces significant amounts of waste gases during certain operating conditions, efforts can be made to avoid those conditions. It is when reduction of flaring becomes a priority for a plant that the proper attention and creative brainstorming can be applied to solve these difficult problems.
Reducing emergency flaring. Unlike routine flaring, emergency flaring from pressure relief valves, rupture disks, pressure safety valves, and basic control valves occurs due to unplanned upset scenarios such as power failures or loss of cooling water. These rates can be in the millions of pounds per hour but may not last for more than a few minutes. In a refinery, it is not economical to recover emergency flaring rates because the cost to design the flare gas recovery system for these short-lived peak rates is not justified. However, instrumented safeguards can be used to lower the likelihood of large releases from certain process units.
Although instrumentation is not necessarily a replacement for a properly designed relief header and flare, instrumentation can reduce the likelihood that large emergency releases occur. Changes to operating procedures, improved training of personnel to respond to process upsets, and changes to process or equipment design are other ways to reduce the likelihood that peak flaring rates occur.
Adding instrumented safeguards such as safety instrumented systems will provide more barriers and reduce the likelihood of peak emergency flaring loads. A common example is cutting steam to the reboiler of a column system. A typical column system configuration is shown in Figure 6. If a power failure results in loss of cooling or reflux to the column system, continued boilup in the reboiler can result in accumulation of vapors that build up pressure in the system and need to be vented to flare. It is often the case that steam can continue to the reboiler during the power failure, either because the boiler is not directly affected by the power failure, or because there is enough inventory in the steam header that can last for several minutes. Adding an instrumented shutdown valve and safety instrumented function that closes the steam supply on high column pressure can stop the vapor generation and prevent the column contents from needing to be vented to flare. Columns with high overhead flowrates, such as atmospheric crude distillation columns, fluidized catalytic cracking unit fractionators, and alkylation unit isostrippers, should be the focus when selecting candidate process systems to add safety instrumented functions.
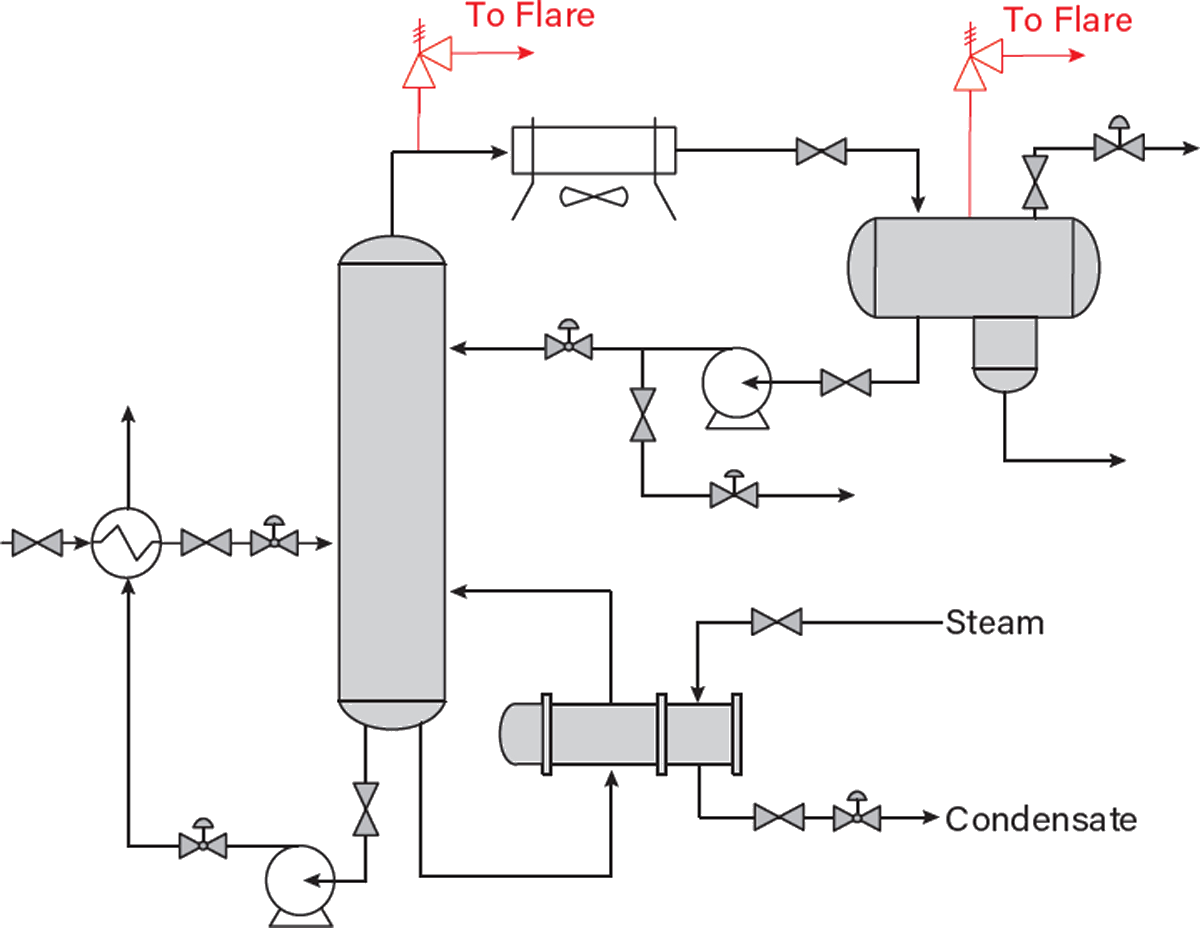
▲Figure 6. Integrating a safety instrumented function that closes the steam supply to the reboiler on high column pressure can prevent the column contents from needing to be vented to flare in the event of a cooling failure.
Reducing emissions from stationary fuel combustion, catalytic cracking, and reforming. While the focus of this article is minimizing emissions due to flaring, it is worth mentioning the current status and feasibility of carbon capture of fluegas from combustion, catalytic cracking, and reforming, which combined make up 96% of GHG emissions from refineries (4).
In a refinery, furnaces are used in fractionation and supply heat required for cracking and reforming. Steam and electricity generation also emit carbon dioxide in the fluegas. Fluid catalytic cracking units emit carbon dioxide in the catalyst regeneration process, and hydrogen production units, typically steam-methane reforming, have carbon dioxide as a byproduct. The key for carbon capture is removing the carbon dioxide from the fluegases and storing or transporting the carbon dioxide.
Capture of carbon dioxide from fluegases is currently achieved using amine solvents, with primary amines having the most aggressive carbon capture capability, followed by secondary amines, then tertiary amines, which are more selective for capture of hydrogen sulfide. High carbon dioxide concentrations at high pressures are easier to capture than low carbon dioxide concentrations at low pressures.
A typical refinery might have two or three fluegas sources that may be feasible to capture, such as a cogeneration utilities unit, hydrogen unit, and exhaust stacks that have multiple fluegas sources. About half of a refinery’s carbon emissions in fluegases will consist of many smaller sources with low carbon dioxide concentrations. These sources may be scattered throughout the refinery with large distances in between. Recovery of these sources may be extremely economically prohibitive due to the capital costs associated with routing the exhaust gases to a common point where it can be captured using a single amine system.
A case study by Shell (16) found that the cost to capture carbon dioxide from about half of a large, complex refinery’s fluegases would be three to four times the current cost of the carbon trading values. The study concluded that to justify the cost of carbon capture from these sources, new technologies, regulations, or an increase in carbon trading values are necessary.
Example flaring data in petrochemical facility
Refineries and oil production wells are relatively straightforward in that the gas composition has a high content of methane that can be continuously or routinely recovered. Design of the recovery compressor, design of the collection system, and determination of the use for the recovered gas have narrow constraints. However, in a chemical plant, both flowrates and compositions can vary drastically. Knowing these flowrates and compositions and evaluating the feasibility of recovering the gases is a foundational prerequisite study in the design process of a flare gas recovery system in a chemical plant.
One case study of a petrochemical plant that produces ethylene glycol, olefins, and other ethylene-based industrial chemicals evaluated the conceptual feasibility of a flare gas recovery system to capture waste gases. Figure 7 shows that the flaring rate ranged typically between 10,000 lb/hr and 25,000 lb/hr and that the units contributing most of the flare gas consisted of primarily light hydrocarbons with a small fraction of nitrogen. Therefore, this example petrochemical plant would likely be well suited for the addition of a flare gas recovery system.
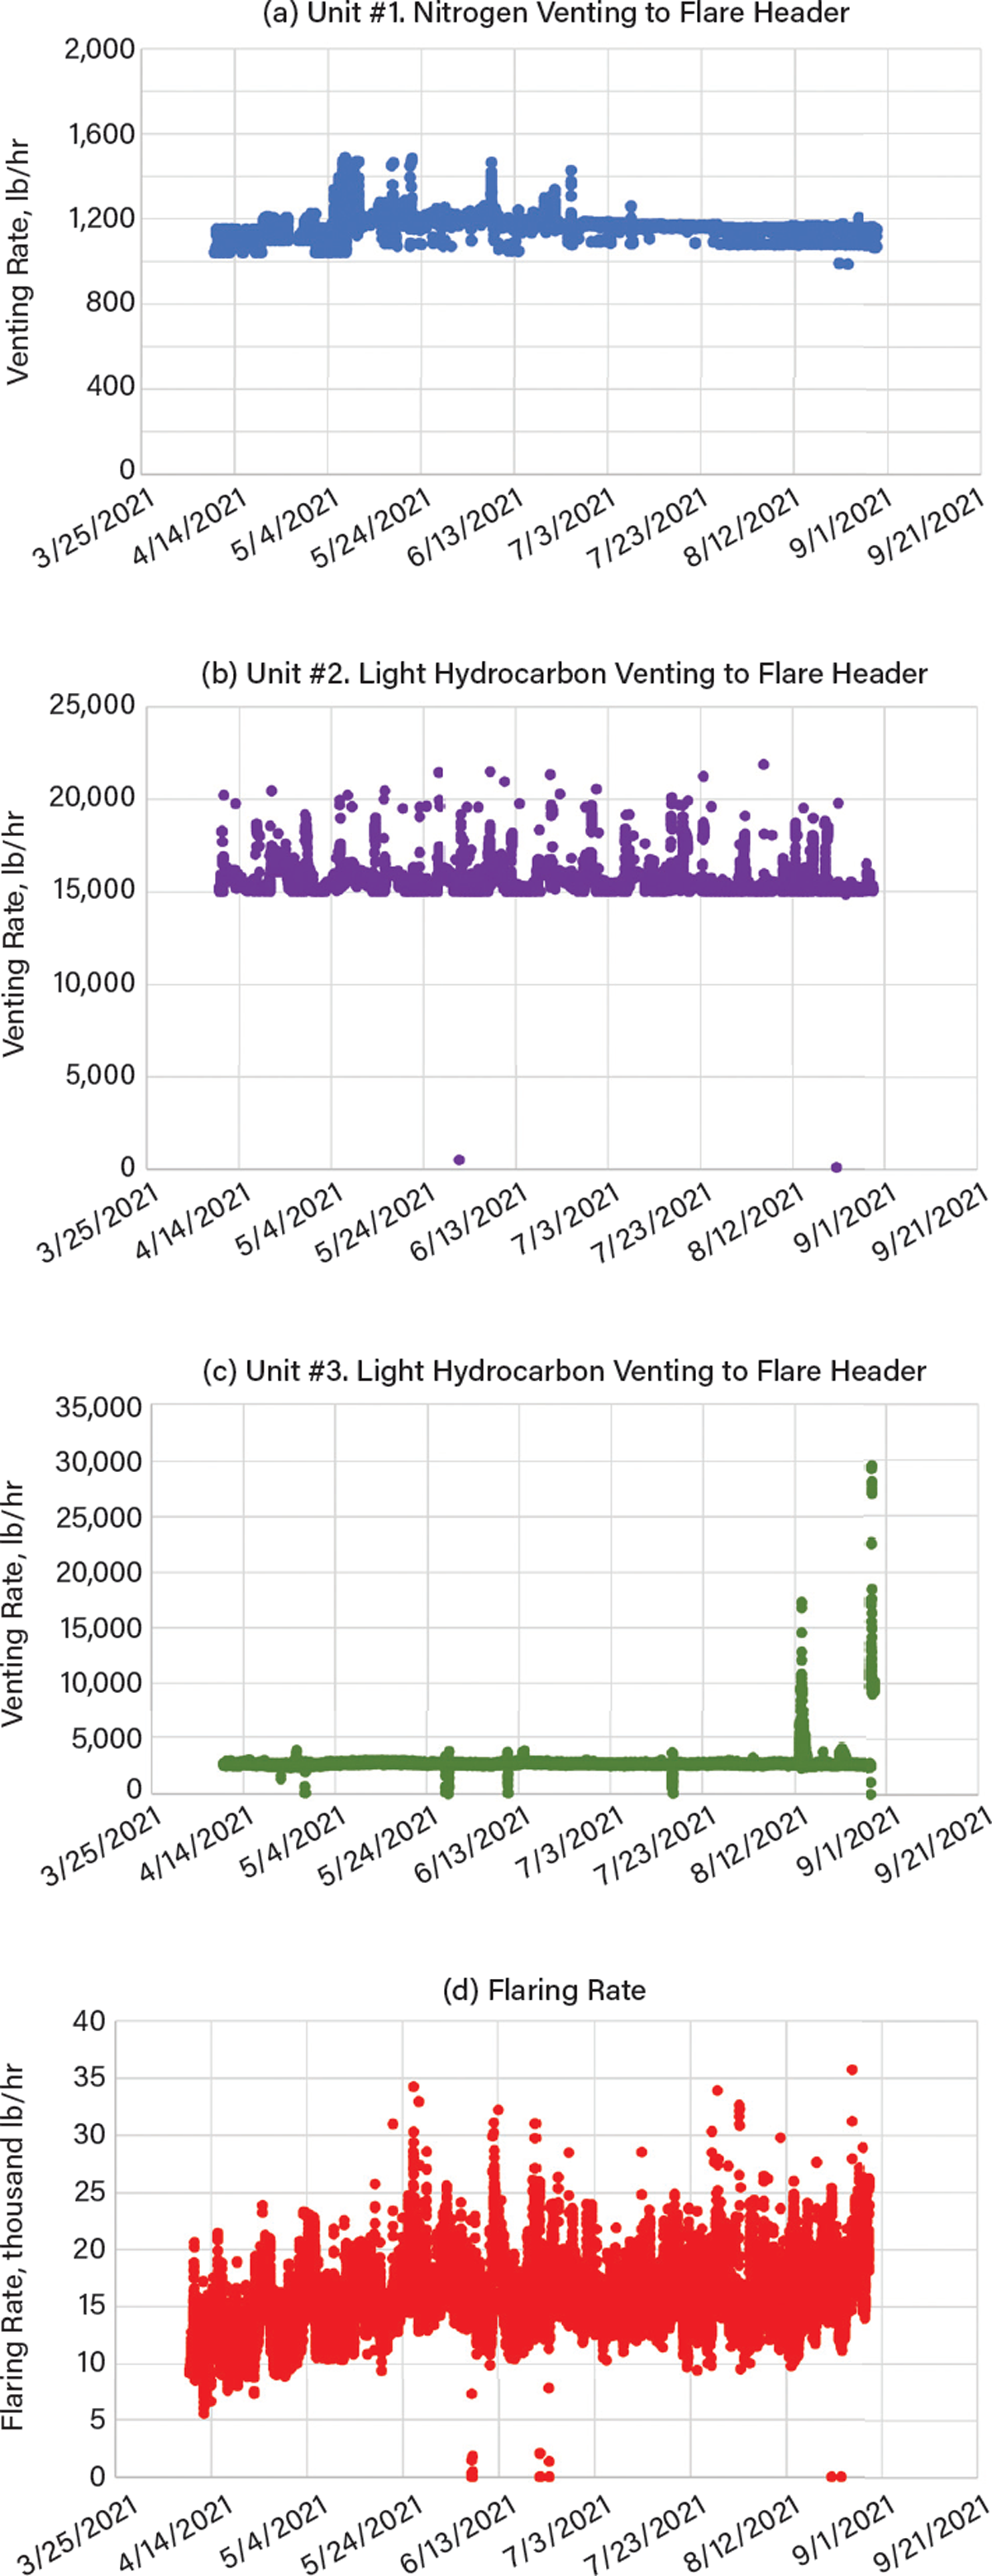
▲Figure 7. Before a flare gas recovery system can be designed and implemented, the flowrates and compositions of the various flare gas sources must be known. An example petrochemical plant that produced ethylene-based industrial chemicals had flare gas that consisted of (a) nitrogen from Unit #1, (b) light hydrocarbon from Unit #2, and (c) light hydrocarbon from Unit #3. (d) The flaring rate without a vapor recovery system ranged primarily between 10,000 lb/hr and 25,000 lb/hr.
Closing thoughts
While the stage has been set for the next decade for oil and gas producers, refineries, and petrochemical facilities to make changes in traditional flaring practices and recover waste gases, there is much work that remains. To meet the Net Zero Routine Flaring by 2030 target and ultimately the Net Zero Emissions by 2050 target, new systems will need to be designed and installed, and regulatory incentives and development of new technologies may be required.
For upstream production, flare gas recovery systems that capture the gas and utilize LNG, CNG, and LPG technologies could become more common. For downstream refineries, flare gas recovery systems will continue to be installed as they make sense from both an economic and environmental perspective. Petrochemical and chemical facilities will assess the feasibility of recovering and using the flare gases. Finally, more developments will need to occur for incentivized capture of post-combustion carbon dioxide from process equipment such as furnaces, hydrocrackers, and reformers.
*This article is based on a presentation given at the 2022 AIChE Spring Meeting and 18th Global Congress on Process Safety (San Antonio, TX, April 10–14, 2022).
Literature Cited
- The World Bank, “Zero Routine Flaring by 2030 (ZRF) Initiative,” https://www.worldbank.org/en/programs/zero-routine-flaring-by-2030 (2022).
- U.S. Environmental Protection Agency, “Sources of Greenhouse Gas Emissions,” EPA, https://www.epa.gov/ghgemissions/sources-greenhouse-gas-emissions (2019).
- U.S. Environmental Protection Agency, “2011–2020 Greenhouse Gas Reporting Program Sector Profile: Petroleum and Natural Gas Systems,” EPA, https://www.epa.gov/ghgreporting/ghgrp-petroleum-and-natural-gas-systems-sector-profile (2020).
- U.S. Environmental Protection Agency, “2011–2020 Greenhouse Gas Reporting Program Sector Profile: Petroleum Refineries Sector,” EPA, https://www.epa.gov/ghgreporting/ghgrp-refineries-sector-profile (2020).
- Schade, G. W., “The Problem with Natural Gas Flaring,” https://today.tamu.edu/2020/08/03/the-problem-with-natural-gas-flaring (2020).
- “Permian Methane Analysis Project,” https://data.permianmap.org/pages/flaring (2022).
- Willyard, K. A., and G. W. Schade, “Flaring in Two Texas shale areas: Comparison of Bottom-Up With Top-Down Volume Estimates for 2012 to 2015,” Science of The Total Environment, 691, pp. 243–251 (Nov. 15, 2019).
- International Energy Agency, “Flaring Emissions,” IEA, https://www.iea.org/reports/flaring-emissions (2021).
- Chapa, S., “Report: Flaring Wasted $750 million of Natural Gas in Permian Basin,” https://www.houstonchronicle.com/business/energy/article/Report-Flaring-wasted-750-million-of-natural-15335793.php (2020).
- The World Bank, “Global Gas Flaring Reduction Partnership (GGFR),” https://www.worldbank.org/en/programs/gasflaringreduction (2022).
- The World Bank, “Global Gas Flaring Tracker Data,” https://www.ggfrdata.org (2020).
- International Energy Agency, “Net Zero by 2050,” https://www.iea.org/reports/net-zero-by-2050 (2021).
- Mansoor, R., and M. Tahir, “Recent Developments in Natural Gas Flaring Reduction and Reformation to Energy-Efficient Fuels: A Review,” Energy & Fuels, 35 (5), pp. 3675–3714 (2021).
- Jari, H. R. K., and A. Borhani, “Minimize Flaring with Modifications to Flare Gas Recovery Unit,” http://gasprocessingnews.com/features/201804/minimize-flaring-with-modifications-to-flare-gas-recovery-unit (2022).
- American Petroleum Institute, “Pressure-Relieving and Depressuring Systems,” API STD 521 (2020).
- Straelen, J. V., et al., “CO2 Capture for Refineries, a Practical Approach,” Energy Procedia, 1 (1), pp. 179–185 (2009).

Copyright Permissions
Would you like to reuse content from CEP Magazine? It’s easy to request permission to reuse content. Simply click here to connect instantly to licensing services, where you can choose from a list of options regarding how you would like to reuse the desired content and complete the transaction.