
An empirical technique — the O’Connell correlation — is widely used to estimate the efficiency of cross-flow trays. This article proposes a modification and clarifies the relationship between the empirical and theoretical approaches.
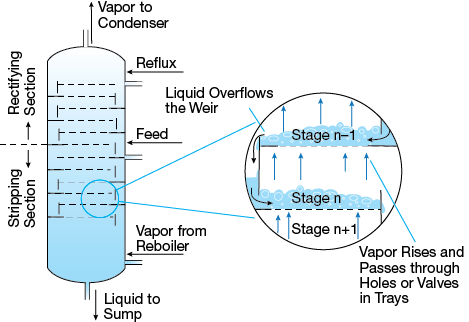
▲Figure 1. Distillation takes place in a column with cross-flow trays over which liquid flows in alternate directions on successive trays. The topmost tray has the highest concentration of the more-volatile species and the lowest tray has the highest concentration of the less-volatile species.
Distillation — the most important unit operation for separating liquid mixtures — is carried out in columns equipped with either packing or trays. In a conventional tray column, vapor rises vertically up through the column while the liquid flows downward and across the trays in alternate directions on successive trays (Figure 1). Column simulation and design software calculates the number of theoretical stages and the section efficiency is used as an efficiency factor to translate theoretical stages to actual trays. The efficiency of a particular section of a column (ηsection) is the number of theoretical stages (nth) found in a section of a column divided by the number of actual trays (ntrays):

O’Connell published a graph showing section efficiencies for bubble cap trays, which can be represented by (1):
where µL is the liquid viscosity in mPa-s and α is the relative volatility.
The relative volatility and the liquid viscosity serve as the only input variables in calculating conventional distillation tray efficiencies with the empirical correlation developed by O’Connell (1). This simple method has survived all attempts at being replaced by more rigorous models, despite lacking a sound theoretical explanation for its success. This article presents a simple, but fundamentally sound, theoretical approach that achieves results equivalent to O’Connell’s correlation using the same number of variables — revealing the hitherto unrecognized relationship between O’Connell’s empirical correlation and other theoretical models. In addition, the article introduces a modification to O’Connell’s correlation that produces a close-to-perfect match between the updated correlation and the derived theoretical model.
The traditional Murphree efficiency approach to tray design
The section efficiency is calculated based on fundamental mass-transfer considerations, including the approach to equilibrium both locally on the tray (point efficiency) and on the tray as a whole (tray efficiency). The conventional method of designing trays (2) employs Murphree’s definition of efficiency to quantify the approach to equilibrium.
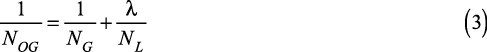
The overall number of transfer units for the gas phase (NOG) is (3):
where NG and NL represent the number of transfer units in the gas and liquid phases (a measure to quantify mass transfer), respectively, and λ is the stripping factor calculated as λ = mG/L, where m is the slope of the equilibrium line and G and L are the gas and liquid flowrates per cross-sectional bubbling area in kmol/m2-s.

The approach to equilibrium that can be achieved with a given number of transfer units depends on the concentration profile — the driving force for mass transfer, which, in turn, depends on the flow pattern of the vapor and liquid phases. Most models for cross-flow trays assume that the vapor flows vertically in plug flow and the liquid is vertically well-mixed. With these assumptions, the Murphree point efficiency on a tray is defined as (3):
The Murphree vapor-phase tray efficiency (ηtray) defines the fractional approach to equilibrium for a single cross-flow tray based on the vapor concentrations on the operating and equilibrium lines. The following assumptions simplify the mathematics: the liquid travels in plug flow across the tray, the point efficiency in Eq. 4 is constant across the tray, and the vapor concentration below the tray is uniform.
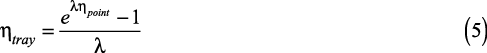
Based on these assumptions, the Murphree tray efficiency is (2):
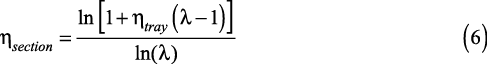
The section efficiency in a distillation column is related to the tray efficiency by (2):
When the equilibrium line is steeper than the operating line, as is typically the case for the stripping section of a column, the stripping factor is greater than one and the section efficiency is less than the tray efficiency. When the stripping factor is less than one, the section efficiency is higher than the tray efficiency, which typically occurs in the rectifying section. When the stripping factor is exactly one the section and tray efficiencies are equal.
The more rigorous efficiency model in Eqs. 3–6 requires a large amount of input data: detailed tray geometry, transport properties of the liquid and vapor phases (diffusivities, viscosities, and densities), operating conditions (pressure, temperature, liquid and gas flowrates), and thermodynamic information (the slope of equilibrium line). This information is necessary for the correlation of mass-transfer coefficients, interfacial area, froth height, bubble regimes, horizontal backmixing, entrainment, and weeping, all of which are required to calculate the numbers of transfer units (and therefore the Murphree point and tray efficiencies) that are needed for column design.
This simplified, theoretical model follows fundamental mass transfer principles.
Postulating connections
If there are any hidden ties between the O’Connell and traditional methods for calculating tray efficiency, the approaches should produce similar results and the following approximation must hold:
It is not obvious why O’Connell used α in his correlation; based on the theoretical model (Eqs. 3–6), it would appear that either the slope of the equilibrium line or the stripping factor is more likely to be relevant. In addition, O’Connell’s method also appears to ignore explicit inclusion of any mass-transfer performance parameters distinguishing the vapor and liquid phases, such as the numbers of transfer units. And yet, the method has been successfully applied in many cases.
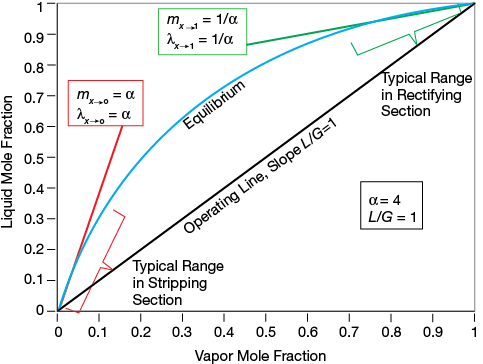
▲Figure 2. This McCabe-Thiele diagram depicts a binary system with a relative volatility of α = 4.
The relative volatility (α) might remain nearly constant and is always greater than one over the entire concentration range for nonazeotropic systems. On the other hand, the stripping factor can vary considerably with concentration. Figure 2 is the McCabe-Thiele diagram for a binary system for which α = 4. The slope of the equilibrium line at low concentrations of the lower-boiling compound (x → 0) becomes α, whereas the slope becomes 1/α at the opposite end of the concentration range (x → 1). The diagonal line in Figure 2 is the operating line (assuming total reflux, i.e., L/G = 1), and, under these circumstances, the stripping factor is α at one end of the vapor-liquid equilibrium line and 1/α at the other end.
Most distillation applications involve a relative volatility less than the α = 4 used in Figure 2, and in such cases the difference between α and λ is less. For α < 1.3, no significant difference exists at any concentration.
Revealing the ties
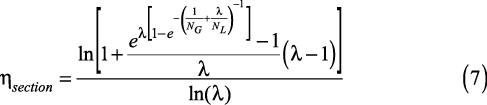
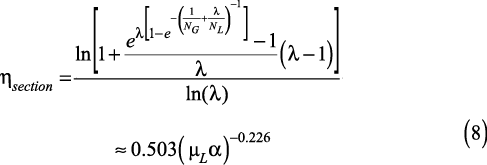
To establish the conditions under which the results of O’Connell’s correlation and the traditional model can agree, the stripping factor (λ), must be used instead of the relative volatility (α), and NG and NL must be expressed in terms of a single variable, namely the liquid viscosity. And, as in O’Connell’s approach, only one constant of proportionality and one fixed exponent will be used to correlate the number of transfer units. These simplifications avoid the cumbersome theoretical approach to calculate NG and NL.

The correlations between NG and NL can be expressed with the same parameters in the form:

where c1 and x1 are constants determined by regression. Regressing c1 and x1 to minimize the difference between the outcome of the theoretical model (the first line of Eq. 8) and O’Connell’s correlation (the second line of Eq. 8) yields the proportionality constant c1= 0.936 and the exponent x1 = –0.25. Thus, Eq. 9 becomes:
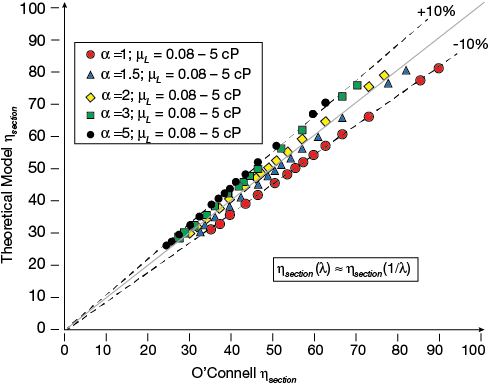
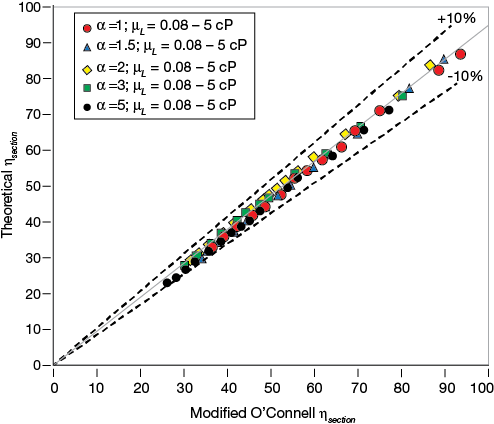
▲Figure 3. A parity plot shows that section efficiencies determined by O’Connell’s correlation agree well with the results of the theoretical model. The range studied, with the relative volatility varying between 1 and 5 and the liquid viscosity varying between 0.08 and 5 mPa-s, covers the majority of commercial distillation applications
Figure 3 reveals the close agreement between the theoretical model and O’Connell’s empirical approach to estimating section efficiencies. The deviation over the range investigated is less than 10%. The section efficiencies obtained from the traditional model were calculated using the stripping factor for x = 0 and x = 1. Astonishingly, substituting Eq. 10 into Eq. 7 produces nearly identical results whether λ or 1/ λ is used. The reciprocal of the stripping factor often is referred to as the absorption factor.
It is important to understand this outcome since this provides the justification for using the relative volatility instead of the stripping factor to represent relevant behavior. While the relative volatility is always greater than one, the stripping factor is smaller than one when the mixture contains high concentrations of the higher-boiling-point compound. Using the stripping factor based on α for x = 0 and x = 1 can, in many cases, reflect the approximate slope at total reflux in the striping and rectifying sections, respectively.
The dependency of the correlation on the liquid viscosity is very similar for the two correlations. However, the dependency on α or λ shows that O’Connell overestimates the impact of α on the section efficiency when compared to the model based on the traditional approach.
Understanding the relationship
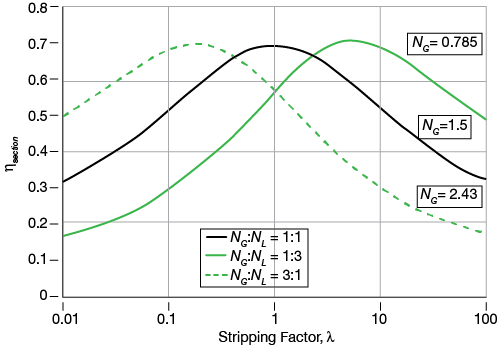
▲Figure 4. The section efficiency calculated by the theoretical approach depends on the stripping factor.
Combining Eq. 10 with Eq. 7 yields almost identical section efficiencies for a given value of the stripping factor and its reciprocal. Figure 4 plots the calculated section efficiencies for three different ratios of NG:NL. To allow a comparison, the stripping factor was varied and NG was adjusted in order to achieve the same maximum section efficiency to reveal apparent symmetries.
In the case of NG = NL (Figure 4), there is an apparent symmetry about λ = 1. Such symmetry is not present in the other two cases. However, the NG = NL curve is not strictly symmetrical about λ = 1, as the efficiencies for values of λ and 1/ λ other than one are slightly different. The use of the relative volatility in O’Connell’s method has a theoretical basis only when such symmetry exists.
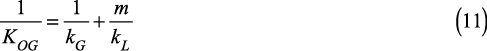
The terms NG and NL quantify mass-transfer behavior in the vapor and liquid phases, respectively. Since the slope of the equilibrium line influences the distribution of the resistances to mass transfer across the two phases, assuming that NG = NL does not imply that the liquid-side and vapor-side resistances to mass transfer are equal. The fundamental relationship of the gas-side and liquid-side mass transfer coefficients is (3):
where KOG is the overall gas-phase mass-transfer coefficient in kmol/m2-s and kG and kL are the gas-side and liquid-side mass-transfer coefficients, respectively, in kmol/m2-s.
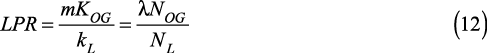
The relative liquid-phase resistance (LPR) in a column is defined as (4):
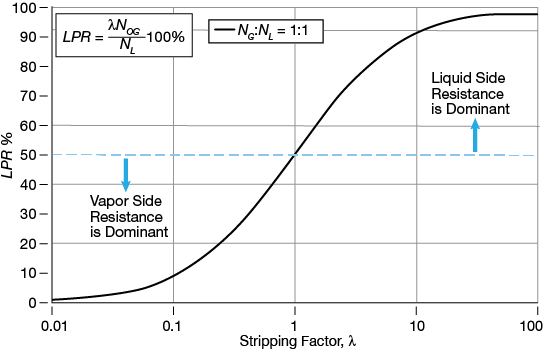
▲Figure 5. The liquid-phase resistance (LPR) depends on the stripping factor and the ratio of NG: NL, which is assumed to be one.
Figure 5 shows the dependency of LPR on the stripping factor. The liquid-phase resistance increases with increasing stripping factor. For small values of λ, the liquid-phase resistance is negligible, whereas for high values of λ, LPR will become dominant, i.e., is more than 50% of the overall resistance.

▲Figure 6. This graph shows the relationship between the stripping factor, various efficiencies, and the number of transfer units, assuming NG = NL = 1. Reducing liquid resistance reduces section efficiencies, the opposite of what is expected, as Murphree tray efficiency increases under the same conditions.
For increasing values of λ above one, the LPR increases and section efficiencies decrease. Thus, it would be reasonable to expect that with decreasing liquid resistance (i.e., for small values of λ), the section efficiency should increase, but this is not the case. To understand this behavior, it is important to quantify the impact of the stripping factor when converting the Murphree tray efficiency to the section efficiency. Figure 6 illustrates the behavior of Eqs. 3–6, which are the basis for the derived model. The section efficiency calculated by Eq. 6 decreases with decreasing λ, explaining the drop in the section efficiency when the stripping factor becomes small, despite the fact that the Murphree tray efficiency increases. This explains why O’Connell’s correlation can use α instead of λ while still achieving meaningful results, provided the assumption NG = NL holds true.
In summary, for increasing values of λ, the liquid-phase resistance becomes dominant and reduces the section efficiency, whereas for decreasing values of λ, the driving force for mass transfer increases. The translation of the tray efficiency to section efficiency is the reason for the decrease of the section efficiency.
Modifying the O’Connell correlation
The derived simplified theoretical model is expected to more accurately predict section efficiencies, albeit with increasing complexity. Therefore, a simple modification to O’Connell’s correlation better reflects theoretical outcomes.
The relative volatility affects the section efficiency in the O’Connell correlation more than it does in the theoretical model. Therefore, the exponent on α should be adjusted independently from the exponent on the liquid viscosity to better match the theoretical prediction.
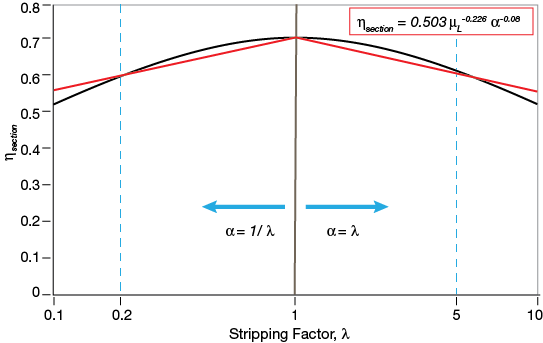
▲Figure 7. The modified O’Connell correlation (red) achieves a good agreement with the traditional model (black) for α < 5 when the exponent for α is –0.08. The liquid viscosity was assumed to be 0.2 mPa-s while α was varied between 1 and 5.
Figure 7 shows the relevant range for adjusting the exponent on α in the O’Connell correlation. The liquid viscosity was assumed to be 0.2 mPa-s while α was varied between 1 and 5. The exponent on α was regressed and the best-match curve revealed the value to be –0.08. The black line represents the theoretical dependency of the section efficiency on the stripping factor. The red line is the outcome using an exponent of –0.08 on α for the modified O’Connell method.

The modified O’Connell correlation (Eq. 2) therefore becomes:

The new exponent for α is now used to regress the proportionality constant (c1). Equation 10 is thus rewritten:
▲Figure 8. A parity plot of section efficiencies calculated by the modified O’Connell correlation and the theoretical model shows almost-perfect agreement.
As the parity plot in Figure 8 demonstrates, the modified O’Connell correlation (Eq. 13) achieves an almost-perfect fit with the combined Eqs. 7 and 14.

Based on theoretical considerations, the stripping factor (λ) or its reciprocal (1/ λ) is preferred over the relative volatility (α). This is because when α is used, it is not possible to distinguish between total and partial reflux conditions; the stripping factor helps to account for this. Therefore, the modified O’Connell correlation can be written as:
where σ = λ if λ > 1 and σ = 1/λ if λ < 1.
Validation
When the O’Connell correlation was modified, the proportionality constant was retained at 0.503. Since this matched reasonably well with experimental data, the aim was not to alter the outcome for small values of α. Chan evaluated more than 200 data points for six systems: cyclohexane/n-heptane, iso-butane/n-butane, ethyl‑benzene/styrene, water/acetic acid, methanol/water, and ammonia/water. He reported the section efficiency, the relative volatility, the average stripping factor, and the operating capacity (5). Chan’s data were used in order to compare the outcome of the original O’Connell correlation with the proposed modification. Data points for capacities of more than 98% or less than 25% were excluded from the analysis because the majority of those data points were associated with reduced efficiency due to jet flood or weeping, respectively.
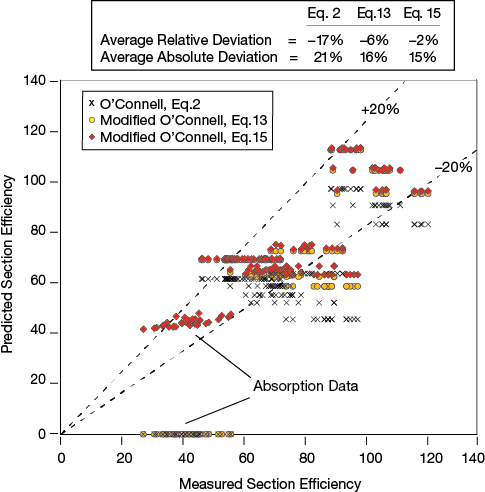
▲Figure 9. Parity plots of measured experimental section efficiencies and efficiencies calculated by the original O’Connell correlation (Eq. 2), the modified correlation using α (Eq. 13), and the modified correlation using λ (Eq. 15) show that the modifications improve the accuracy of the correlation.
Figure 9 indicates that using the exponent of –0.08 for the relative volatility improves the prediction of section efficiency. Using the stripping factor improves the accuracy further, but, more importantly, it allows Eq. 15 to be used for absorption and stripping applications as well as for distillation.
In closing
O’Connell’s empirical correlation is similar to the traditional theoretical tray efficiency model approach when the number of transfer units for the liquid phase and the vapor phase can be assumed to be equal. O’Connell’s use of the relative volatility approximates the stripping factor in the stripping section or its reciprocal in the rectifying section. Overall, the outcome of the O’Connell method agrees well with a theoretical model using the same number of parameters, namely a constant of proportionality, c1, and an exponent, x1, associated with the liquid viscosity.
The impact of liquid viscosity on the section efficiency should not be interpreted as representing only the liquid-side properties. Most distillation systems are gas-side controlled and are well represented by the approach shown here. Indeed, the liquid viscosity correlates well with other relevant properties, such as the effective interfacial area or the gas-phase residence time. A low liquid viscosity improves gas dispersion and can therefore increase the interfacial area.
Finding the reason for the success of O’Connell’s correlation and its connections to traditional theoretical efficiencies justifies its use in distillation applications while also revealing its limitations without the appropriate modifications.
Nomenclature
| c 1 | = proportionality constant |
| G | = gas throughput per cross-sectional bubbling area, kmol/m2-s |
| kG | = gas-side mass-transfer coefficient, kmol/m2-s |
| kL | = liquid-side mass-transfer coefficient, kmol/m2-s |
| KOG | = overall gas-side mass-transfer coefficient, kmol/m2-s |
| L | = liquid throughput per cross-sectional bubbling area, kmol/m2-s |
| LPR | = liquid-phase resistance |
| m | = slope of the equilibrium line |
| NG | = number of transfer units in gas phase |
| NL | = number of transfer units in liquid phase |
| NOG | = overall number of transfer units in gas phase |
| nth | = number of theoretical stages |
| ntrays | = number of actual trays |
| x 1 | = exponent to be applied to the liquid viscosity |
Greek Letters
| α | = relative volatility |
| ηpoint | = Murphree vapor point efficiency |
| ηtray | = Murphree vapor tray efficiency |
| ηsection | = section efficiency or overall efficiency |
| µ | = viscosity, mPa-s or cP |
| λ | = stripping factor = mG/L |
| σ | = either stripping or absorption factor used in Eq. 15 |
Subscripts
| G | = gas or vapor |
| L | = liquid |
Acknowledgments
The authors thank Sulzer Chemtech and Clarkson Univ. for making Markus Duss’s sabbatical possible in 2016. This paper is based in part on work carried out during this sabbatical at Clarkson Univ.
Literature Cited
- O’Connell, H. E., “Plate Efficiency of Fractionating Columns and Absorbers,” Transactions of the American Institute of Chemical Engineers,42, pp. 741–775 (1946).
- Lewis, W. K., “Rectification of Binary Mixtures,” Industrial and Engineering Chemistry, 28 (4), pp. 399–402 (1936).
- Lockett, M. J., “Distillation Tray Fundamentals,” Cambridge Univ. Press, New York, NY (1986).
- Chen, G. X., and K. T. Chuang, “Liquid-Phase Resistance to Mass Transfer on Distillation Trays,” Industrial and Engineering Chemistry Research,34 (9), pp. 3078–3082 (1995).
- Chan, H., “Tray Efficiencies for Multicomponent Distillation Columns,” PhD Dissertation, the Univ. of Texas at Austin (May 1983).
1

Copyright Permissions
Would you like to reuse content from CEP Magazine? It’s easy to request permission to reuse content. Simply click here to connect instantly to licensing services, where you can choose from a list of options regarding how you would like to reuse the desired content and complete the transaction.