
This is an expanded version of an article that appeared in the June 2017 issue of Chemical Engineering Progress.
Chemical engineers continue to earn more than the average U.S. worker. The median salary of survey respondents is $124,000 — 2.4% lower than the median reported in 2015.
The results of AIChE’s biennial salary survey are in and they provide a mixed outlook of the chemical engineering profession.
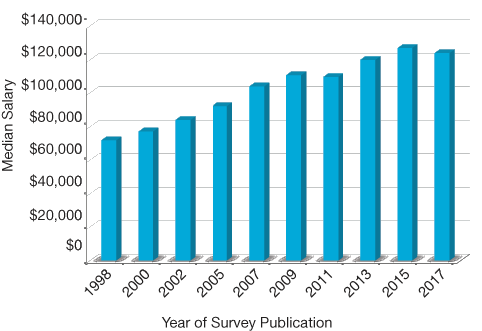
▲Figure 1. The median salary for chemical engineers this year is slightly lower than the median reported in 2015.
The median annual salary of survey respondents working full-time is $124,000, which is 2.4% lower than the median of $127,000 reported in 2015. In comparison, the previous salary survey reported a 5.8% increase in median salary between 2013 and 2015 (Figure 1).
The decrease in median salary was unexpected. A factor contributing to the decline may be that this year’s survey was conducted by a different research and analysis firm. In taking a fresh look at the data and methodology, they identified several procedural changes that could improve the accuracy and reliability of the report. We feel that this year’s data provide a better baseline for future comparisons.
Median salaries ranged from $70,450 for chemical engineers with fewer than three years of experience to $156,000 for those with more than 40 years in the workforce. Numerous other factors — including age, gender, education, job function, and industry — were also examined for their impact on chemical engineers’ paychecks. In addition, for the third time, AIChE looked at the influence of time off for family reasons on salary.
| Table 1. Base salary trends, 1992–2017. | |||||
| Year of Survey* | 1st Decile | 1st Quartile | Median | 3rd Quartile | 9th Decile |
| 1992 | $40,400 | $48,000 | $59,700 | $74,500 | $95,000 |
| 1994 | $42,000 | $50,000 | $63,600 | $80,000 | $101,000 |
| 1996 | $44,000 | $54,000 | $68,200 | $85,000 | $105,000 |
| 1998 | $44,500 | $55,000 | $72,000 | $90,000 | $110,000 |
| 2000 | $49,000 | $61,000 | $77,200 | $95,000 | $114,500 |
| 2002 | $53,500 | $65,000 | $84,000 | $103,000 | $124,500 |
| 2005 | $60,000 | $75,000 | $92,150 | $115,000 | $140,000 |
| 2007 | $67,540 | $83,700 | $103,730 | $129,408 | $158,000 |
| 2009 | $69,230 | $88,421 | $110,950 | $140,000 | $180,000 |
| 2011 | $67,200 | $87,000 | $110,000 | $140,000 | $177,700 |
| 2013 | $70,000 | $94,075 | $120,000 | $150,000 | $195,000 |
| 2015 | $72,000 | $97,000 | $127,000 | $160,000 | $200,000 |
| 2017 | $58,000 | $70,000 | $124,000 | $140,000 | $175,000 |
| * Data generally reflect the previous year’s salary, as most questionnaires were deployed in February or March of the year of the survey. | |||||
Would you like to access the complete CEP Article?
No problem. You just have to complete the following steps.
You have completed 0 of 2 steps.
-
Log in
You must be logged in to view this content. Log in now.
-
AIChE Membership
You must be an AIChE member to view this article. Join now.
Copyright Permissions
Would you like to reuse content from CEP Magazine? It’s easy to request permission to reuse content. Simply click here to connect instantly to licensing services, where you can choose from a list of options regarding how you would like to reuse the desired content and complete the transaction.