(670a) Biomolecular Ultrasound Imaging of In Vivo Phagolysosomal Function
AIChE Annual Meeting
2020
2020 Virtual AIChE Annual Meeting
Food, Pharmaceutical & Bioengineering Division
Cheaper, Better, Faster, Stronger - Enhancements to Established Sensing Techniques
Friday, November 20, 2020 - 8:00am to 8:15am
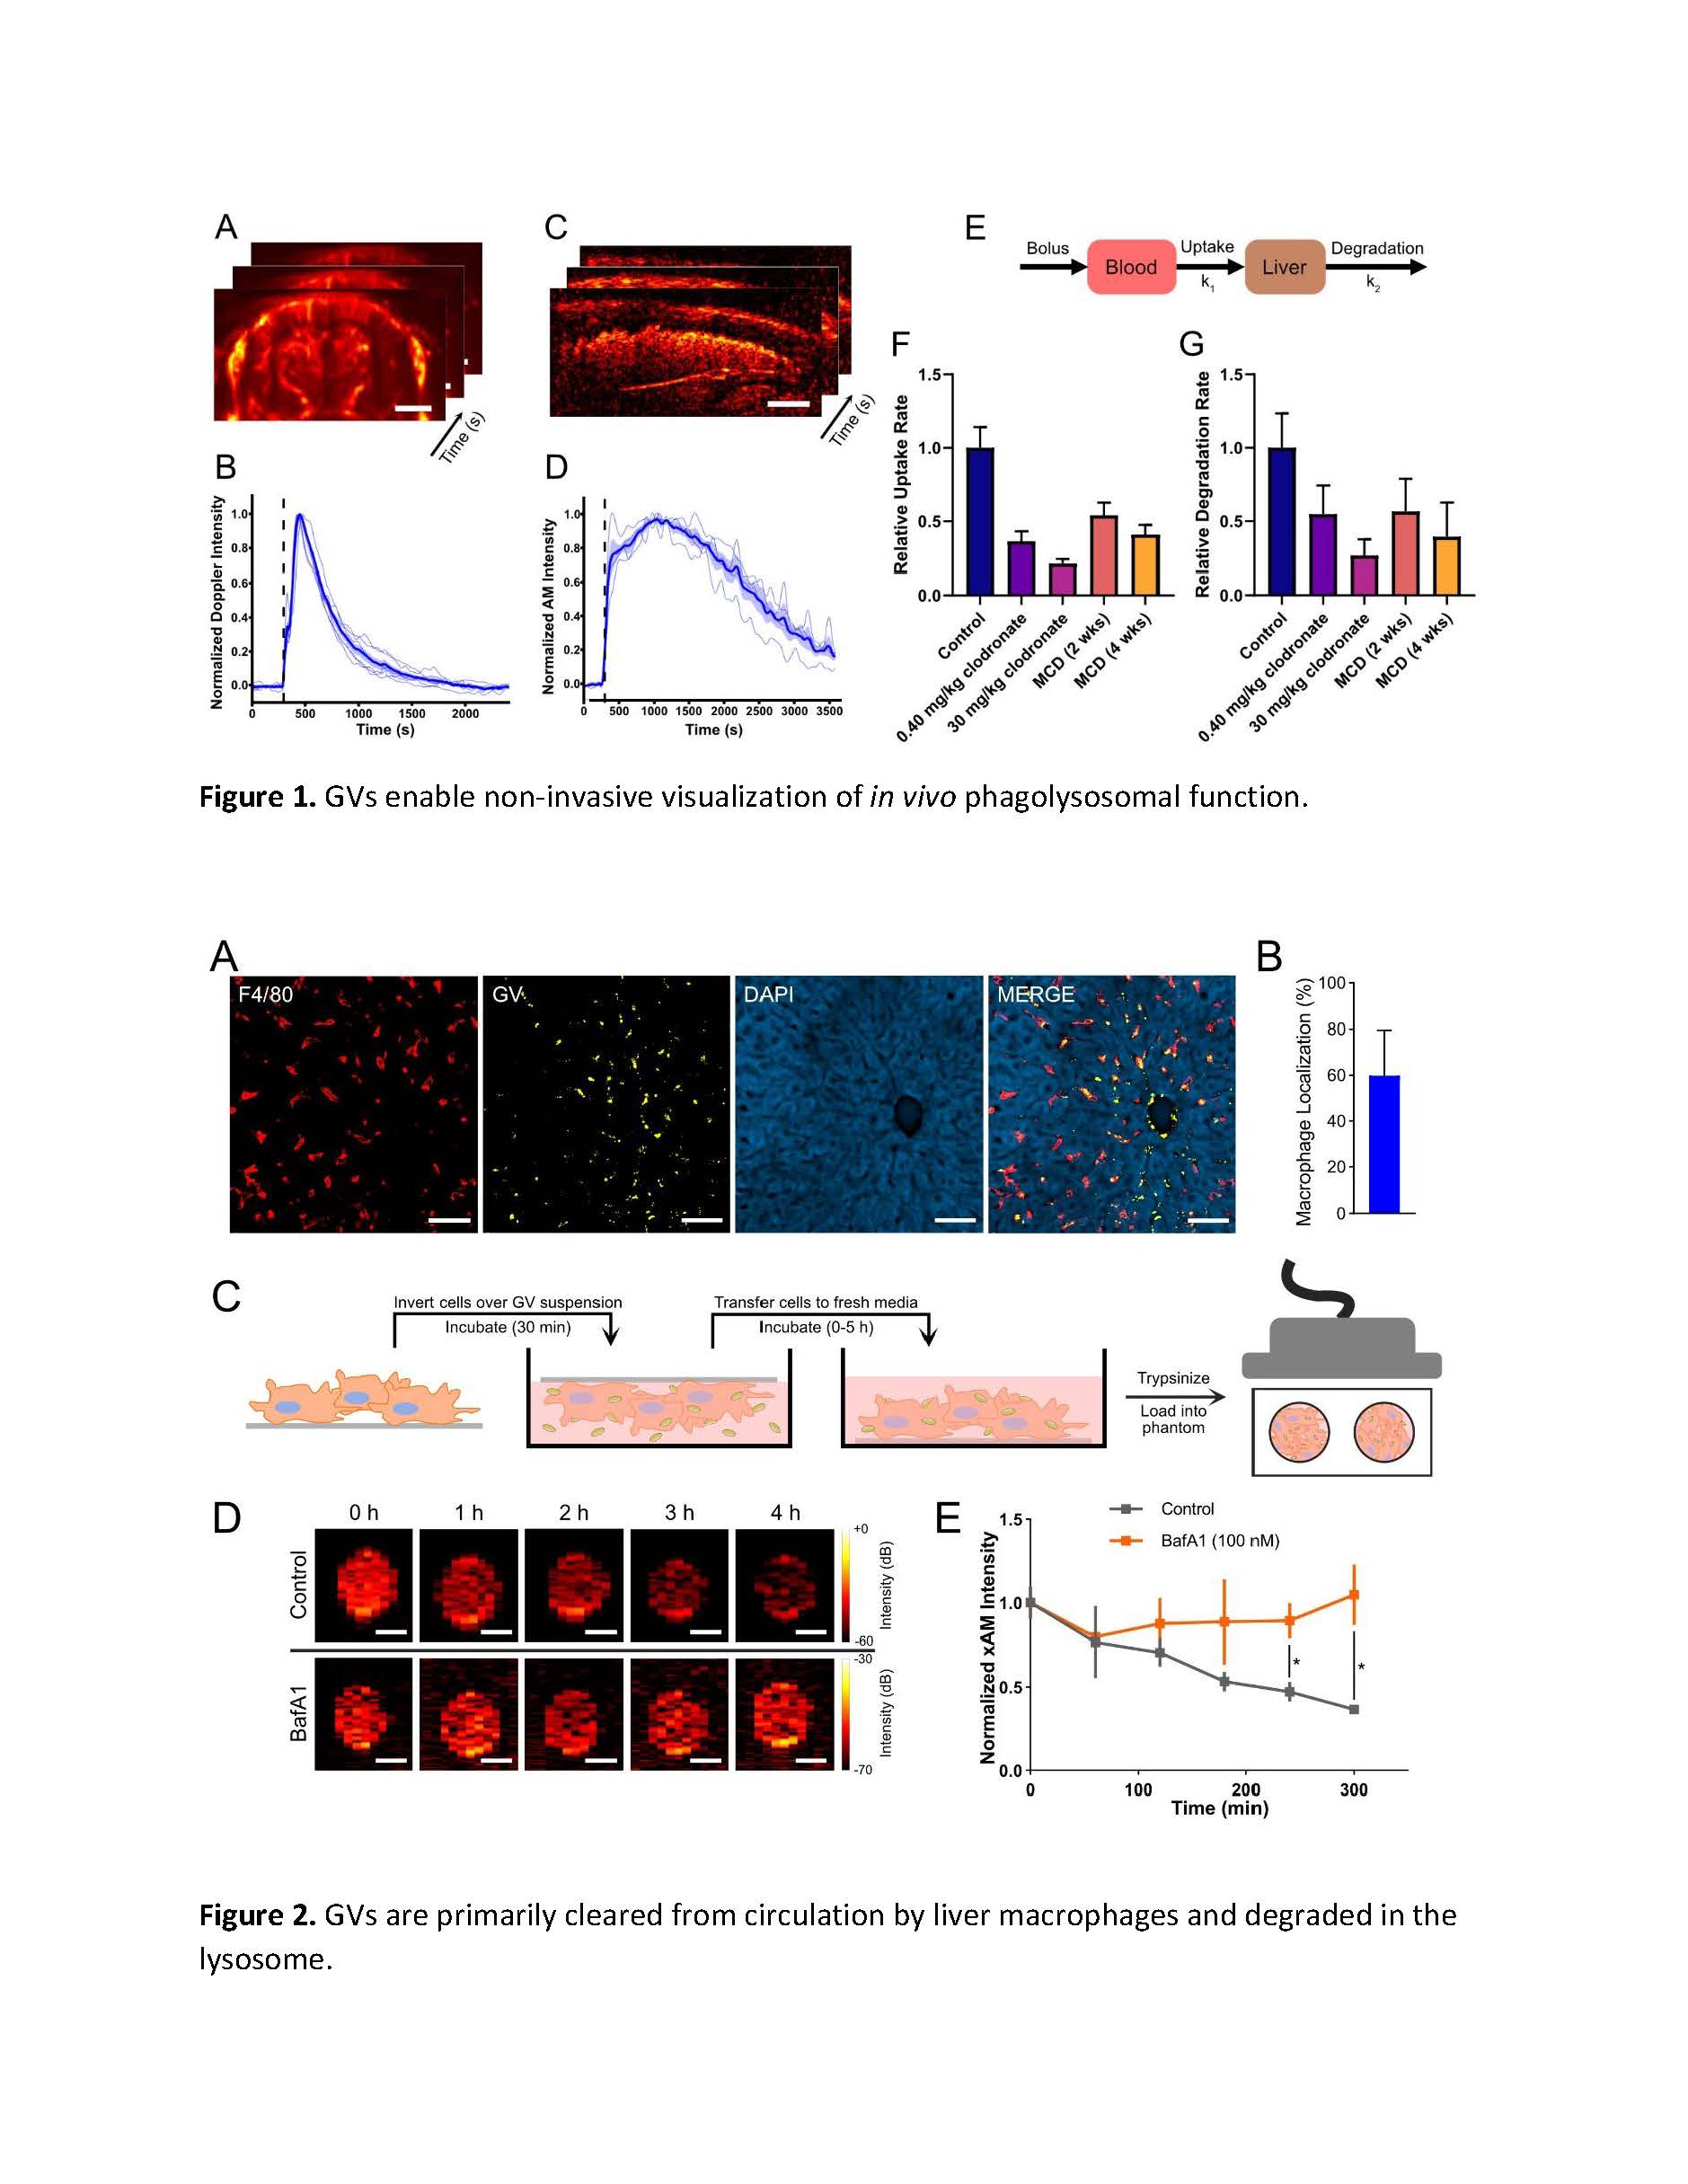
Figure 1. Gas vesicles enable non-invasive visualization of in vivo phagolysosomal function. In all experiments, images were acquired at 0.25 Hz and purified GVs (0.35 pmol in 100 μL saline) were injected intravenously 300 s after the start of imaging. A) We measured the temporal dynamics of hemodynamic signal enhancement—as a proxy for GV concentrations in the blood—with transcranial ultrafast Doppler ultrasound. Scale bar: 2 mm. B) Time course of Doppler signal. Individual trials are shown as light traces. Shaded area represents ±SEM. Thick line represents average of N = 6 biological replicates. C) We next applied amplitude modulation (AM) imaging to visualize GV dynamics in the liver. Scale bar: 2 mm. D) Time course of AM signal. Individual trials are shown as light traces. Shaded area represents ±SEM. Thick line represents average of N = 5 biological replicates. E) We fit our ultrasound data to a two-compartment pharmacokinetic model in order to derive rate constants for the interdependent processes of uptake (F) and degradation (G). Rates are normalized to those of age-matched litter-mate control mice. GV concentrations in the blood and liver were represented by our Doppler and AM time courses, respectively. Liver dysfunction was modeled by clodronate-mediated macrophage ablation and by diet-induced non-alcoholic steatohepatitis (MCD). In both cases, uptake and degradation rates were significantly suppressed. Error bars represent ±SD. N=4-6.
Figure 2. GVs are primarily cleared from circulation by liver macrophages and degraded in the lysosome. A) Confocal micrographs of liver sections from mice euthanized one hour after injection with Alexa Fluor 647-labeled GVs. Macrophages were labeled with anti-F4/80. B) Colocalization of GVs with macrophage areas. Images were segmented in ilastik and quantified in MATLAB. Error bar represents ±SD. N=4 mice, with a total of 60 fields of view analyzed. C) Diagram of in vitro uptake of GVs. RAW264.7 cells were cultured on fibronectin-coated cover slips and inverted over a dilute suspension of GVs engineered to produce non-linear contrast. After 30 min, the cells were transferred to clean media and allowed to process the GVs for predetermined intervals before loading into an ultrasound phantom. D) Cross-propagating amplitude modulation (xAM) images of cell pellets. GV contrast declined in control cells but persisted in cells pre-treated with 100 nM bafilomycin A1 to inhibit lysosomal activity. E) Quantification of xAM signal, adjusted for cell density and normalized to the initial timepoint. Error bars represent ±SEM. N=4-8 biological replicates per timepoint.