(182a) Gas-Phase Cyclic Voltammetry for Detection of Tuberculosis Associated Volatile Organic Compounds in Breath Using Co-Tna
AIChE Annual Meeting
2020
2020 Virtual AIChE Annual Meeting
Topical Conference: Chemical Engineers in Medicine
Diagnostics, Treatments and Theranostics
Monday, November 16, 2020 - 8:00am to 8:15am
MN and MPA can be electrochemically detected using a cobalt-functionalized titanium dioxide nanotube array (Co-TNA) sensor, as shown by Bhattacharyya et. al [3]. Specificity is attained by the functional metal (in this case cobalt) interacting with the analytes of interest reproducibly. Traditionally, this sensing platform was operated using a simple two-electrode setup and chronoamperometric methods, in which a constant bias voltage is applied to the sensor surface and analyte interactions are observed by the resulting current change. However, chronoamperometric techniques are prone to confounders, as they are not able to separate signals from interactions occurring at smaller potentials or those resulting from surface resistance changes, for example when excess water is present. This is especially problematic in human breath which can contain hundreds of unique VOCs. In liquid systems, the presence of a third reference electrode allows this problem to be mitigated by employing scanning potential techniques, which allow the analyst to observe interactions at many potentials rather than just one. Therefore, our lab has modified the sensing platform to use a 3D-printed electron-conductive polymer as a solid-state electrolyte analogous to a salt solution in traditional liquid electrochemistry in order to create a gas-phase three-electrode system. This modification means that complex potential-scanning techniques can be performed on a fully solid-state sensor, a unique ability that is extremely important when running tests at the point-of-care where a long sensor shelf life is often necessary.
Using this new platform, cyclic voltammetry (CV) methods have shown promise in detecting TB VOCs more specifically than chronoamperometry alone. Features of interest present in CVs such as peaks, hysteresis, gradients, adsorption/ desorption events and current magnitudes are indicative of specific sensor interactions. Examples of these features can be seen in Figure 1. Lab studies using as little as 1 L of breath result in significantly different CV curves for clean vs MN spiked breath (an important TB biomarker). Figure 2 illustrates these differences, in which the CV of MN spiked breath exhibits a variance from the traditional smooth CV curve in the region where MN is expected to interact with cobalt (< 0.5 V), as well as hysteresis on the back scan (a peak which causes the overlapping of the forward scan). Cataloging the presence of these features and the voltage potentials at which they occur over a large set of breath profiles will allow us to understand how the sensor responds differently when exposed the breath of TB positive vs negative patients. This is imperative to developing a useful TB diagnostic tool. Therefore we utilize numerical methods via Python in order to quantify results from the obtained CVs. Average and localized gradients, peak detection, numerical integration for current magnitude, and hysteresis detection via regression analysis and optimization methods will be used to quantify data and make conclusions.
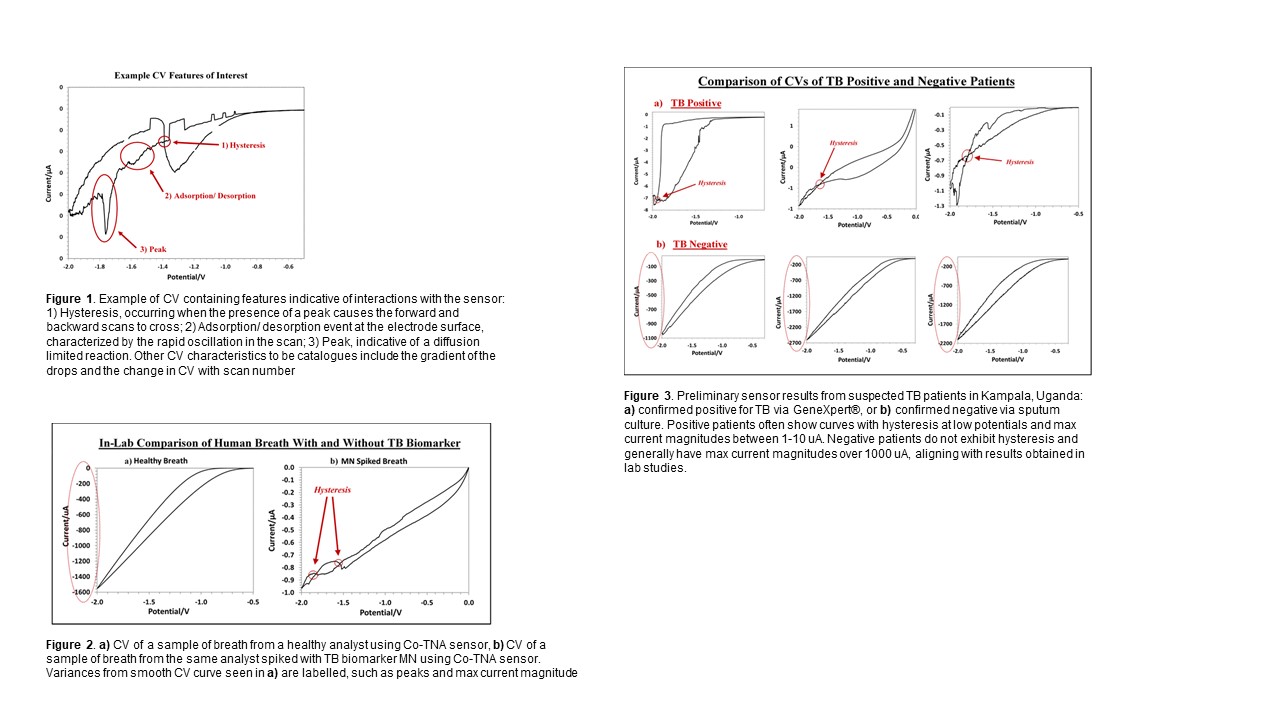
In order to better understand how these sensors perform on suspected TB patients, an ongoing field study is being conducted in collaboration with Makerere University located in Kampala, Uganda. Breath is collected from patients in Tedlar® bags and tested using a setup identical to that used in the lab. The results are analyzed using the numerical methods described, creating a catalog of interactions seen in true patient breath. The patients then undergo standard tuberculosis testing via collected sputum using smear microscopy, GeneXpert® testing and mycobacterial culture to confirm TB status. This allows us to better refine our parameters for classifying TB positive and negative patients, increasing the specificity of the sensor. These results are then validated by testing for the presence of TB biomarkers using thermal desorption coupled with GC-MS. Preliminary results shown in figure 3 illustrate the differences between CVs obtained from TB positive and negative patients. The resulting curves show a similar pattern to those obtained in lab mimics with healthy vs MN spiked breath (see figure 2). Once a significant number of patients have been tested, computer-driven analysis of patient curves can be used to develop accurate correlations in order to distinguish between TB positive and negative patients.
Data comparing sensor and GC-MS results obtained from lab mimics as well as confirmed TB patients will be presented.
References:
[1] World Health Organization, “Status of the TB epidemic,†2019.
[2] Syhre M, Chambers S, “The scent of Mycobacterium tuberculosis.†Tuberculosis, 2008; 88:317-23.
[3] D. Bhattacharyya, Y. R. Smith, S. K. Mohanty, and M. Misra, “Titania Nanotube Array Sensor for Electrochemical Detection of Four Predominate Tuberculosis Volatile Biomarkers,†J. Electrochem. Soc., vol. 163, no. 6, pp. B206–B214, 2016.