(286b) Development and Application of Customized Symbols in PI Vision for KPI Monitoring Based on the Greenscope Methodology
AIChE Annual Meeting
2022
2022 Annual Meeting
Topical Conference: Next-Gen Manufacturing
Future of Manufacturing and Emerging Technologies
Tuesday, November 15, 2022 - 8:25am to 8:50am
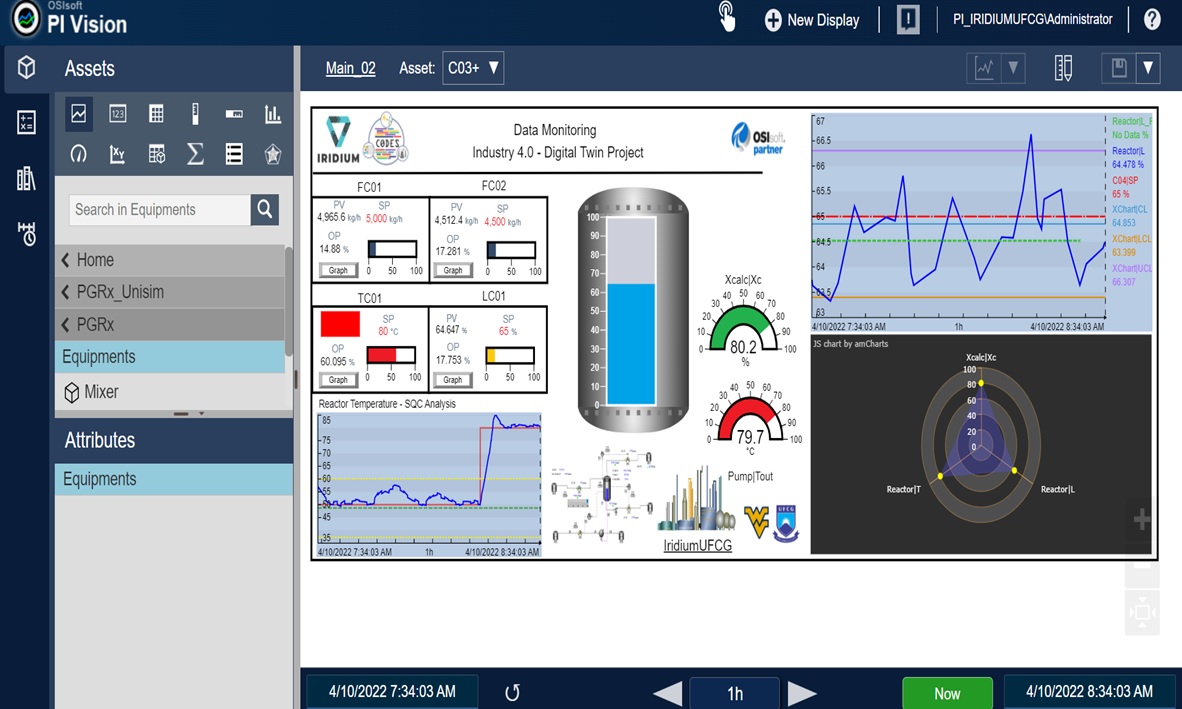
This work is related to the monitoring of process indicators based on GREENSCOPE using the PI System Architecture. The following indicators have been selected for evaluating and monitoring a dynamic simulated chemical process: reaction yield, total energy cost, total energy consumption, resource energy efficiency, and environmental quotient [2, 3]. For this purpose, a PI System Client Tool, PI Vision, is used for visualization of the KPIs, via the PI AF (Asset Framework), as shown in Figure 1.
Through the PI Data Archive provided by the PI server, the chemical process data is processed on PI AF, and the KPIs are calculated. The visualization has been possible by the PI Vision, where an extensibility model allowed the development of custom symbols for a better understanding of the relation between the KPI values. Such symbols are written in HTML, CSS, and JavaScript languages, enabling the inclusion of exclusive/sector-specific forms of data visualization. For this purpose, a radar diagram symbol has been developed, allowing the monitoring of the performance of the implemented indicators in PI AF, providing robust critical analysis and assessment of the process in focus.
REFERENCES
- Krajnc, D.; Glaviˇc, P. Indicators of sustainable production. Clean Technol. Environ. Policy 2003, 5, 279–288.
- Ruiz-Mercado, G.; Smith, R. L.; Gonzalez, Appendix C: GREENSCOPE: Technical User’s Guide. U. S. Environmental Protection Agency, 2014.
- Ruiz-Mercado, G. J. et al. Sustainability Indicators for Chemical Processes: I. Taxonomy. Industrial & Engineering Chemistry Research, 2011.