
Follow a guided approach to measure solids properties, choose bin shapes, and calculate hopper angles and outlet sizes for effective storage and use.
Engineers are often asked to design or recommend equipment for storing and handling bulk solid feedstocks, intermediates, and products. Unfortunately, chemical engineers’ education and training on bulk solids are often insufficient for such tasks. To make the situation more difficult, critical solids flow properties are often unavailable and must be determined experimentally.

▲Figure 1. Common geometries for hoppers, bins, and silos include (a) conical, (b) wedge, (c) transition, and (d) pyramidal.
In bulk solid storage discussions, the terms hopper, bin, and silo are often used interchangeably. Hopper and bin frequently refer to small storage vessels, while silo usually refers to tall vessels that store several tons of material. Examples of hopper, bin, and silo geometries are given in Figure 1. In this article, the term bin is used to describe a storage vessel of any volume. The converging section of a storage vessel is called the hopper section.
This article presents methods for measuring fundamental bulk solids flow properties and explains how to use them to design hoppers, bins, and silos for reliable flow. It expands on previous CEP articles devoted to solids storage and handling and bin design by providing a step-by-step guide to the graphical analyses and calculations necessary for bin design (1, 2). An example calculation section illustrates how to specify storage vessel shapes, outlet sizes, and hopper angles.
The first step in the design process is to determine the fundamental properties needed to predict the flow behavior of bulk solids: cohesive strength, internal friction, compressibility, wall friction, and permeability. Test results are used to calculate the size of the hopper section outlet and the recommended hopper angle. The properties are determined by calculations, measurements, and graphical analysis.
Cohesive strength, internal friction, and compressibility
Shear cell testers are used to measure cohesive strength, internal friction, and compressibility.
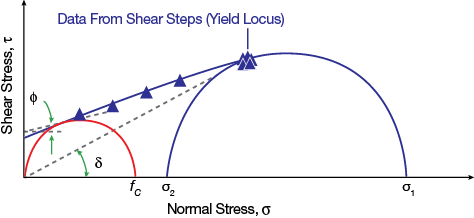
▲Figure 2. The yield locus, determined by the shear cell tests, is used to calculate the major principal stress (σ1), unconfined yield strength (fC), effective angle of friction (δ), and kinematic angle of internal friction (φ).
To measure cohesive strength, place a sample in a cell and preshear the sample: Exert a normal stress (σ) and shear it until the measured shear stress (τ) is steady and the sample is consolidated. Next, conduct the shear step: Reduce the vertical compacting and shear the sample until it fails. Repeat the preshear and shear steps at the same consolidation level for a range of normal stresses. To determine the yield locus, plot the failure shear stress against the normal stress (Figure 2).
The next step in the data analysis is to determine the major principal stress (σ1), i.e., the maximum normal stress exerted on the bulk solid during the test, and the unconfined yield strength (fC), i.e., the cohesive strength of the bulk solid. This is done by constructing a graphical representation of the stress transformation equations (referred to as a Mohr’s circle) to determine the components of stresses acting on the bulk solid.
First draw a line through the shear step data. Next, draw a semicircle tangential to the yield locus line at the average of the steady-state results. The larger-valued intersection of the semicircle with the horizontal axis is the major principal stress (σ1). Then draw a second semicircle tangent to the yield locus through the origin. The other point of intersection of this circle and the horizontal axis is the unconfined yield strength (fC). Most modern automated shear cell testers assume that the yield locus is linear, which allows analytical expressions to be used to calculate σ1 and fC.
The volume is recorded during a shear cell test so that the material’s bulk density (ρb) is also measured.
These shear cell tests are also used to find the effective angle of friction (δ) and the kinematic angle of internal friction (ϕ). To find the effective angle of friction, draw a line through the origin that is tangent to the larger Mohr’s circle. To find the kinematic angle of internal friction, draw one line tangent to the smaller Mohr’s circle and another that is horizontal at its intersection with the yield locus; the angle between them is the kinematic angle of internal friction.
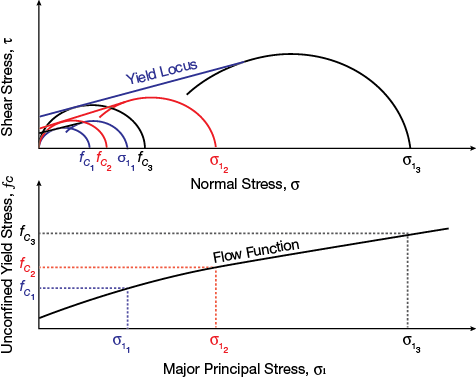
▲Figure 3. The flow function is the relationship between the major stress and the unconfined yield strength. A graphical representation is constructed by connecting the points of different yield locus measurements.
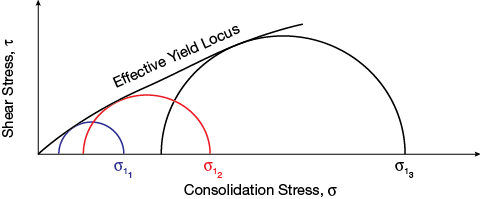
▲Figure 4. The curve drawn tangent to the larger Mohr’s circles is the effective yield locus.
The plot of the unconfined yield strength (fC) against the major principal stress (σ1) is the flow function of a bulk solid, and describes the relationship between a bulk material’s cohesive strength and its consolidation stress. Figure 3 shows the construction of a flow function from three yield locus measurements. An envelope of the Mohr’s semicircles forms the effective yield locus (Figure 4).
Wall friction angle
To measure the friction between a bulk solid and a vessel’s wall material, place a sample of the bulk solid inside a retaining ring on a flat coupon of the wall material. Apply a normal load to the bulk solid so that it slides along the stationary wall material, and measure the steady shear stress. Reduce the load and continue the test.
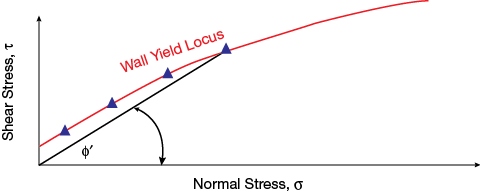
▲Figure 5. The wall yield locus is constructed by plotting shear stress against normal stress.
To construct the wall yield locus, plot the shear stress against the normal stress (Figure 5). The angle of wall friction (ϕ′) is the angle that is formed between the horizontal axis and a line drawn from the origin to a point on the wall yield locus. Note that the wall friction angle is constant only when the yield locus is a straight line that passes through the origin; otherwise, the wall friction angle decreases with increasing normal stress.
Some bulk materials gain cohesive strength and adhere to wall surfaces when they are stored at rest, so if a bin is not expected to operate continuously, time tests are conducted to measure the cohesive strength and static friction between the wall surface and the bulk solid after storage at rest (3). The time test subjects the sample of powder to a normal load for a period of time (e.g., two to three days to simulate a weekend downtime) at the start of test.
Permeability

To determine the permeability of a bulk solid, run a gas through a bed of powder contained in a cylinder. Measure the pressure and flowrate in two locations of the bed. The permeability (K) is calculated from Darcy’s Law:
where u is the superficial gas velocity, P is the gas pressure, ΔP is the difference between two pressure measurements separated by a distance of h in the bed, g is the acceleration due to gravity, and ρb is the bulk density.
Bin design
The design of a new bin takes into account the cohesiveness of the bulk solid, headroom or footprint constraints, segregation concerns, the likelihood of degradation over time (e.g., caking or spoilage), and discharge rate requirements.
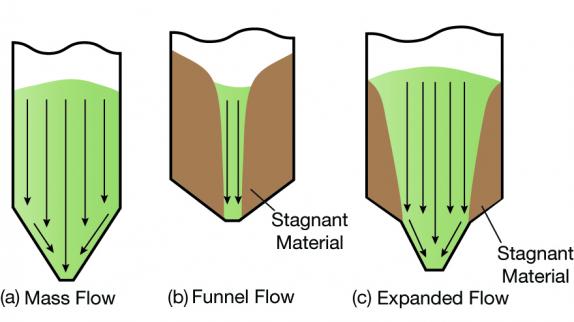
▲Figure 6. Mass flow (a) ensures a more-uniform discharge of bulk solids than funnel flow (b) or expanded flow (c).
Three flow patterns can occur in a bin: mass flow, funnel flow, and expanded flow. In mass flow (Figure 6a), the entire bed of solids is in motion when material is discharged from the outlet. This behavior prevents the formation of stagnant material and ratholes, affords a first-in/first-out flow sequence, and ensures a more uniform velocity profile during operation.
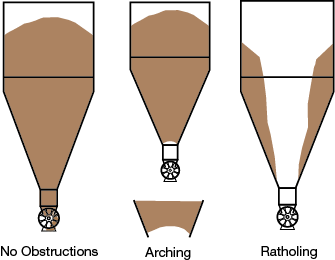
▲Figure 7. Obstructions such as cohesive arches and ratholes prevent flow through a hopper.
In funnel flow (Figure 6b), a channel of flowing solids forms above the outlet and stagnant material remains at the periphery. Bins in which funnel flow occurs may require a very large outlet to ensure that the ratholes collapse, stagnant material does not accumulate, and the bin empties (Figure 7). Funnel flow can cause erratic flow and exacerbate segregation, and stagnant material may spoil or cake.
Designing a mass flow bin with the desired capacity for a facility that has headroom restrictions may be a challenge. In general, for a given...
Would you like to access the complete CEP Article?
No problem. You just have to complete the following steps.
You have completed 0 of 2 steps.
-
Log in
You must be logged in to view this content. Log in now.
-
AIChE Membership
You must be an AIChE member to view this article. Join now.
Copyright Permissions
Would you like to reuse content from CEP Magazine? It’s easy to request permission to reuse content. Simply click here to connect instantly to licensing services, where you can choose from a list of options regarding how you would like to reuse the desired content and complete the transaction.