
Sections
A strong and active energy management program is key to reducing greenhouse gas emissions from chemical processes.
If you think about the chemical industry in terms of processes, distillation, synthesis, polymerization, oxidation, and reduction come to mind. Each of these processes transforms raw materials into a needed product. In chemistry, the variety of possibilities and processes is endless. The one common factor in all of these transformational processes is that they require energy consumption. Some chemical reactions are exothermic and do create heat, which can be useful, but overall, energy is consumed in these transformational processes.
Based on the chemistry of combustion, the direct consumption of fossil fuels or the indirect consumption of electricity will result in the production of carbon dioxide (CO2). Therefore, if an organization consumes natural gas and electricity at its site to manufacture a chemical product, then that organization is responsible for the related carbon emissions.
Fossil-fuel energy consumption and carbon emissions have a direct connection. There is no way to get around this. If your organization consumes energy, then your organization is responsible for the release of a directly correlated amount of CO2. So, if you want to reduce your carbon emissions, you must have a strong strategic energy management (SEM) program.
This article will explore the relationship between carbon and energy, the potential sources of carbon emissions relative to energy consumption, how energy efficiency improvements can reduce carbon emissions, and the available programs for implementing SEM to help manage carbon emissions.
The big picture
Let’s start with some basic energy concepts and orders of magnitude to put things in perspective. Understanding the energy big picture will give a basis to then dive deeper into the methods of applying SEM to chemical industrial processes, with a focus on reducing energy-related greenhouse gas (GHG) emissions.
Figure 1 shows a Sankey diagram of estimated energy consumption in the U.S. in 2021 (1). The total estimate is 97.3 quadrillion BTUs. The units used in the Sankey diagram in Figure 1 are quadrillion BTUs, which are sometimes referred to as quads of energy. To put it into perspective, if the entire state of Texas was covered by 1 quadrillion gallons of water, the water would be around 18 ft deep.
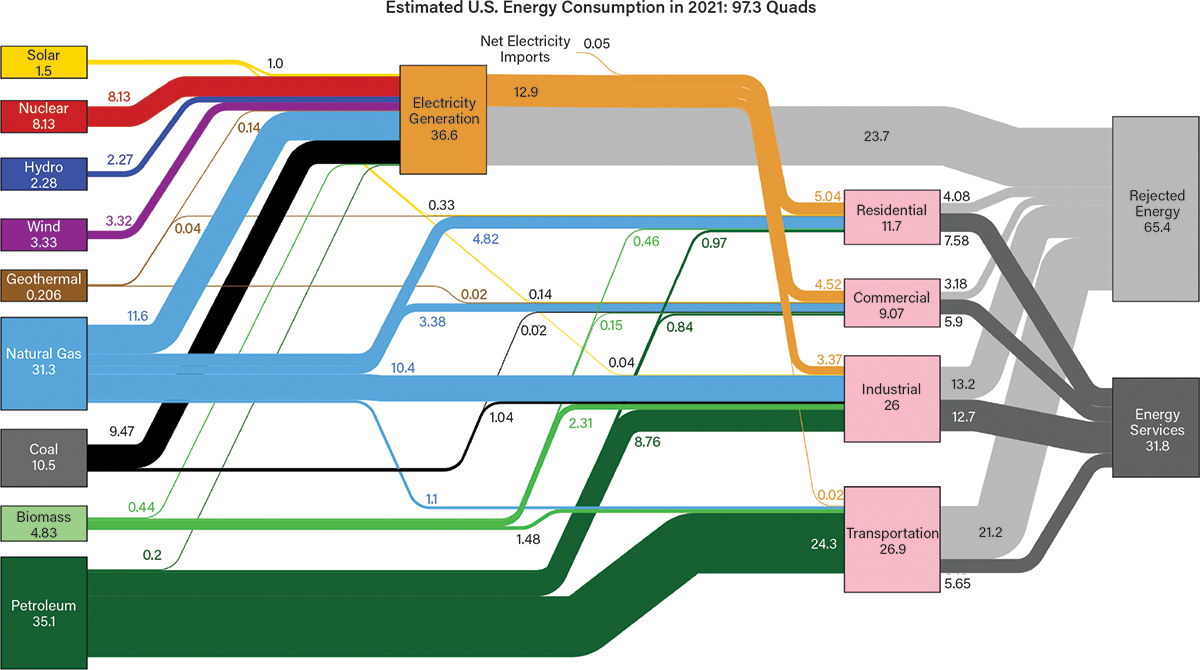
▲Figure 1. The Sankey diagram shows how energy transfers from the source to the end use; the thickness of the line depicts the amount of energy. The left-hand side of the figure shows the breakdown of energy sources such as solar, nuclear, hydro, natural gas, coal, petroleum, and others, while the right-hand side shows the breakdown of the end uses of all this energy. Source: Adapted from (1).
Another item to note in Figure 1 is that the fossil fuels of natural gas, coal, and petroleum are still exceptionally large energy sources for electrical generation and industrial processes. Additionally, while electric vehicles are making a small impact in transportation, note how much of the transportation segment is still powered by fossil fuels.
Figure 2 shows that most of the thermal processing energy consumed by the chemical industry is from carbon-emitting fossil fuel sources used for fuel heating (orange bar) and steam heating (light green bar). The thermal processing energy alone for the chemical industry market segment accounts for approximately 1.75 quadrillion BTUs (2). The chemical industry energy consumption would fall into the industrial block in Figure 1.
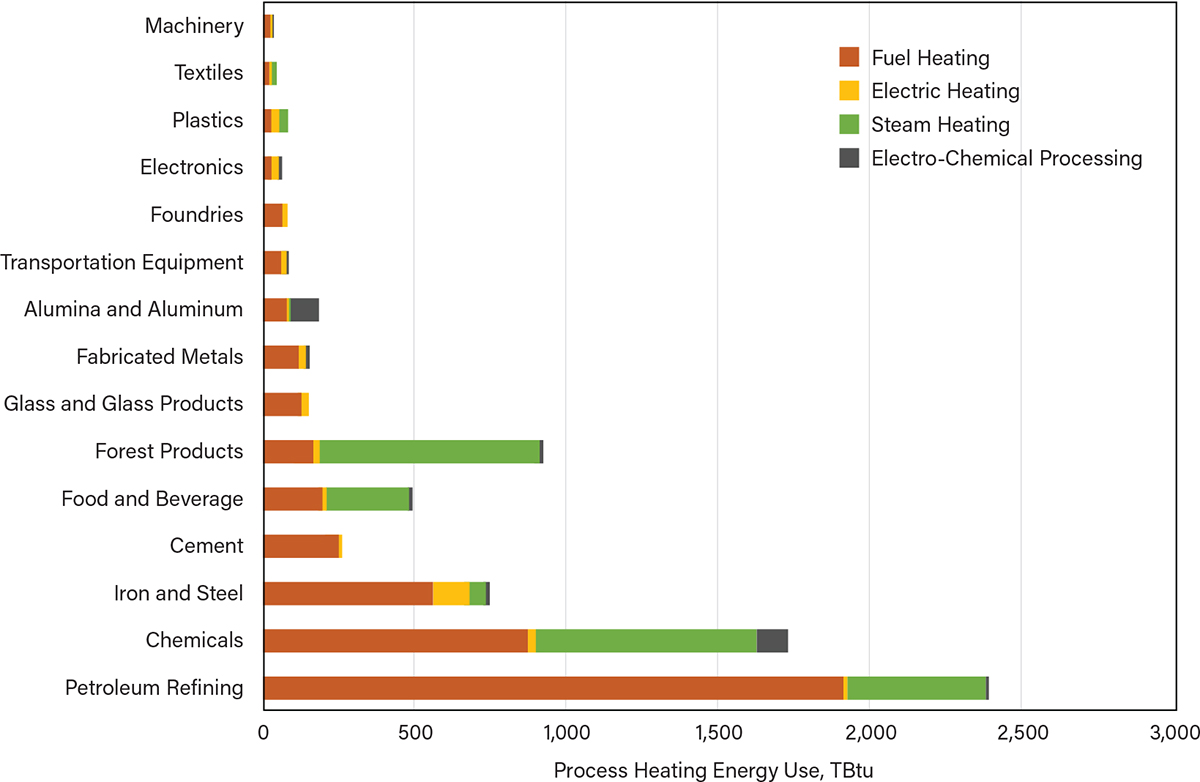
▲Figure 2. The chemical industry is one of the largest consumers of process-heating energy, requiring 1,750 trillion (or 1.75 quadrillion) BTUs. Most of this process-heating energy relies on fossil fuels that generate significant greenhouse gas (GHG) emissions. Source: Adapted from (2).
It is clear that the industrial sector is a significant fossil fuel consumer, and within this segment, the chemical industry is also a significant fossil fuel consumer. Across the chemical industry, there is significant energy to be managed and energy-related GHG emissions to be accounted for.
Energy efficiency
Energy efficiency is a basic energy concept that can be applied to an entire manufacturing site, process, system, or one specific piece of equipment. Energy efficiency is typically a ratio expressed as a percentage. Figure 3 shows the energy efficiency relationship in a mini-Sankey diagram:
- Ein is the term for energy in. This is what you pay for on your natural gas and electric invoices from your local utilities. Once you pay for this energy and bring it on-site, it is up to your organization as to how you consume it and how you control your losses.
- The system/process box is where energy is applied to transform raw materials into a final useful product.
- Eout is the energy that was successfully applied and added value to the product, as intended by the process.
- The peeling-off loss arrow shows the amount of energy lost, in any form, which did not add value to the product. The goal of any process is to minimize the amount of this loss arrow. Energy improvement projects can help to reduce this loss arrow.

▲Figure 3. The goal of energy efficiency improvement is to optimize the energy output (Eout) by reducing the energy input (Ein) and the number of losses. This energy efficiency improvement process also reduces the associated GHG emissions.
The energy efficiency of a system or process can be calculated as follows:
Efficiency = Eout / Ein
- Example: Ein = 1,000,000 BTUs and Eout = 850,000 BTUs
- Efficiency = 850,000/1,000,000 = 85%
Energy intensity
Energy intensity relates to the amount of energy consumed relative to the amount of product created by a process or a system. Energy intensity is expressed in terms of the total amount of energy consumed, divided by the amount of useful product created.
Examples of energy intensity values for the chemical industry include:
- MMBTUs per gallon
- MMBTUs per barrel
- MMBTUs per pound or ton.
Trending the energy intensity for your organization’s processes can be an excellent way to evaluate the impact of implementing SEM and specific energy improvement projects. Energy efficiency and energy intensity are related such that increasing the energy efficiency of processes and systems should decrease the energy intensity of that same process or system.
So far, we have shown that the chemical industry is very energy-intensive and that there is a significant amount of energy to manage with SEM programs. Also, understanding the energy efficiency and energy intensity of your processes and systems is critical to forming the basis for a strong SEM program.
GHG and carbon basics
If you consume fossil fuel energy, you will have energy-related GHG emissions to account for. We will explore the types of GHGs, sources of GHG emissions (with a focus on processes that produce CO2), and definitions of the various scopes of GHG emissions.
A GHG is any gas that can absorb infrared radiation emitted from the Earth’s surface and reradiate it back to the Earth’s surface, thus contributing to the greenhouse effect (3). GHGs let the sun’s light shine onto Earth’s surface, but they trap the heat that reflects up into the atmosphere. In this way, they act like the insulating glass walls of a greenhouse (4).
In other words, a GHG acts as insulation for the Earth just like plastic or glass walls act as insulation in a greenhouse, even on a cold, sunny winter day, hence its name.
The Greenhouse Gas Protocol defines greenhouse gases very specifically. In this standard, GHGs are the six gases listed in the Kyoto Protocol: CO2, methane (CH4), nitrous oxide (N2O), hydrofluorocarbons (HFCs), perfluorocarbons (PFCs), and sulfur hexafluoride (SF6) (5).
Figure 4 shows two pie charts that give an overview of GHG emissions in the U.S. (6). While the GHG Protocol defines six gases, Figure 4 shows that at 79%, CO2 is by far the largest contributor. Also, the second pie chart shows that 24% of U.S. GHG emissions come from the industrial sector.

▲Figure 4. When referring to GHG emissions, you often hear the term carbon footprint. This is because carbon dioxide (CO2) dominates the GHG pie chart at 79%. Additionally, GHG emissions specifically related to energy consumption are nearly all carbon dioxide. Source: Adapted from (6).
Based on the information in Figure 4, we can see why many organizations refer to things like carbon footprint, carbon inventory, carbon accounting, or carbon offsets. CO2 is not the only GHG, but it is the largest contributor to GHG emissions.
Defining the scopes of GHG emissions
The Greenhouse Gas Protocol defines specific scopes of GHG emissions, which is particularly useful for helping an organization determine how to account for their energy-related GHG emissions. Figure 5 shows a graphic to help visualize Scope 1, Scope 2, and Scope 3 GHG emissions (7).
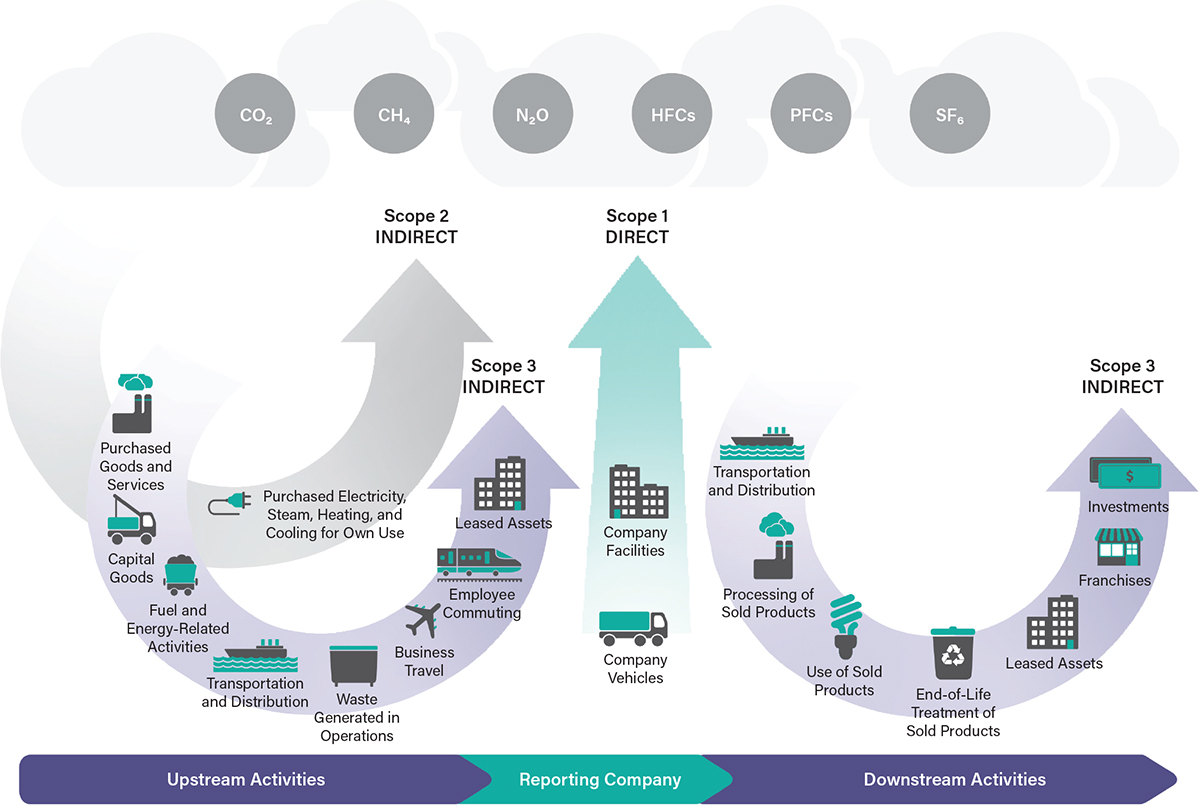
▲Figure 5. This diagram shows an overview of the GHG Protocol scopes and emissions across the value chain. Think about your product in terms of embodied CO2, or in other words, how much energy-related Scope 1, Scope 2, and Scope 3 GHG emissions (i.e., CO2) are generated to create one unit of your product. Understanding the embodied carbon, or carbon intensity, of your product will help you to create targets to reduce your GHG emissions across your entire value chain. Source: Adapted from (7).
Scope 1: Direct GHG emissions. Direct GHG emissions occur from sources that are owned or controlled by the company (e.g., emissions from combustion in owned or controlled boilers, furnaces, or vehicles). This includes emissions from chemical production in owned or controlled process equipment (5).
In practical terms, if your organization has process combustion or vehicle internal combustion on your manufacturing site, then you are directly creating Scope 1 GHG emissions from energy-related consumption. Other Scope 1 GHG emissions could include methane or refrigerant leaks (i.e., fugitive emissions), but we will focus on GHG emissions related to energy consumption.
Scope 2: Electricity indirect GHG emissions. Scope 2 accounts for GHG emissions from the generation of purchased electricity consumed by the company. Purchased electricity is defined as electricity that is purchased or otherwise brought into the organizational boundary of the company. Scope 2 emissions physically occur at the facility where electricity is generated (5).
A practical example of an indirect Scope 2 emission is an electric motor operating at your manufacturing site. The electric motor does not have direct GHG emissions but it consumes electricity that an electric utility must generate somewhere outside the manufacturing plant. Fossil fuel used by the electric utility to generate electricity is an indirect Scope 2 GHG emission that the manufacturing plant operating the motor must take into account.
One point of clarification: If your manufacturing plant generates electricity on-site with, for example, a natural gas turbine generator, then the natural gas combustion for that generator would be considered a direct Scope 1 GHG emission for the site.
Scope 3: Other indirect GHG emissions. Scope 3 emissions are a consequence of the company’s activities but occur from sources not owned or controlled by the company. Some examples of Scope 3 activities are the extraction and production of purchased raw materials, transportation of purchased fuels, and use of sold products and services (5).
In terms of energy, a way to think about Scope 3 GHG emissions is to consider all of the upstream energy that is consumed to get everything you need to your manufacturing site, all of the downstream energy that is consumed by getting your product to market, and then the product’s energy use over its lifetime. Determining Scope 3 GHG emissions can be particularly challenging. In many cases, Scope 3 GHG emissions are much greater than the more site-specific Scope 1 and Scope 2 GHG emissions.
Methane combustion
During typical natural gas combustion, CH4 combines with oxygen (O2) to form CO2 and water (H2O). This same process is true for any carbon-based fuel. If you imagine all the combustion happening across the globe at any given time, it is easy to see the problem and the need for CO2 emissions reduction. In the most basic terms, if you have a combustion process on your site, then you directly emit CO2 to the Earth’s atmosphere. In terms of GHG emissions accounting, this direct combustion is Scope 1.
The great benefit of the combustion of fossil fuels is the creation of the heat and power required for industrial processes and vehicle internal combustion engines. That is why combustion is so common in manufacturing processes. Later, we will explore programs and processes to help reduce the required amount of combustion.
The electricity consumed for things like fans, blowers, or conveyors that support combustion processes also has a carbon component. This electricity consumption contributes to a site’s carbon footprint as a Scope 2 GHG emission.
The diversity of electricity carbon content
The electricity consumption at your manufacturing site has an associated carbon content and is considered an indirect Scope 2 GHG emission. Unlike combustion, which has a known GHG emission rate based on the fuel type, the GHG emission rates from consuming electricity vary from utility to utility. The GHG emission rates from electric utilities are based on the fuels they used to generate their electricity. For example, if an electric utility had more renewable and nuclear electricity generation, they would have a lower GHG emissions rate per MWhr than an electric utility that primarily burned coal for their electricity generation.
Figure 6 shows a graphic for the overall U.S. electrical generation by a mix of resources for 2023 (8). Overall, electric utilities in the U.S. generated 58.1% of the U.S. electricity using natural gas and coal in 2023. To get more specific, the U.S. Environmental Protection Agency (EPA) tracks the diverse electrical generation portfolios by region, so you can determine the average carbon content of your electricity based on your geographic location. The EPA interactive “eGRID” (9) shows a map of electrical generation subregions and their average CO2 emission rates in pounds of CO2 per MWhr of generated electricity.
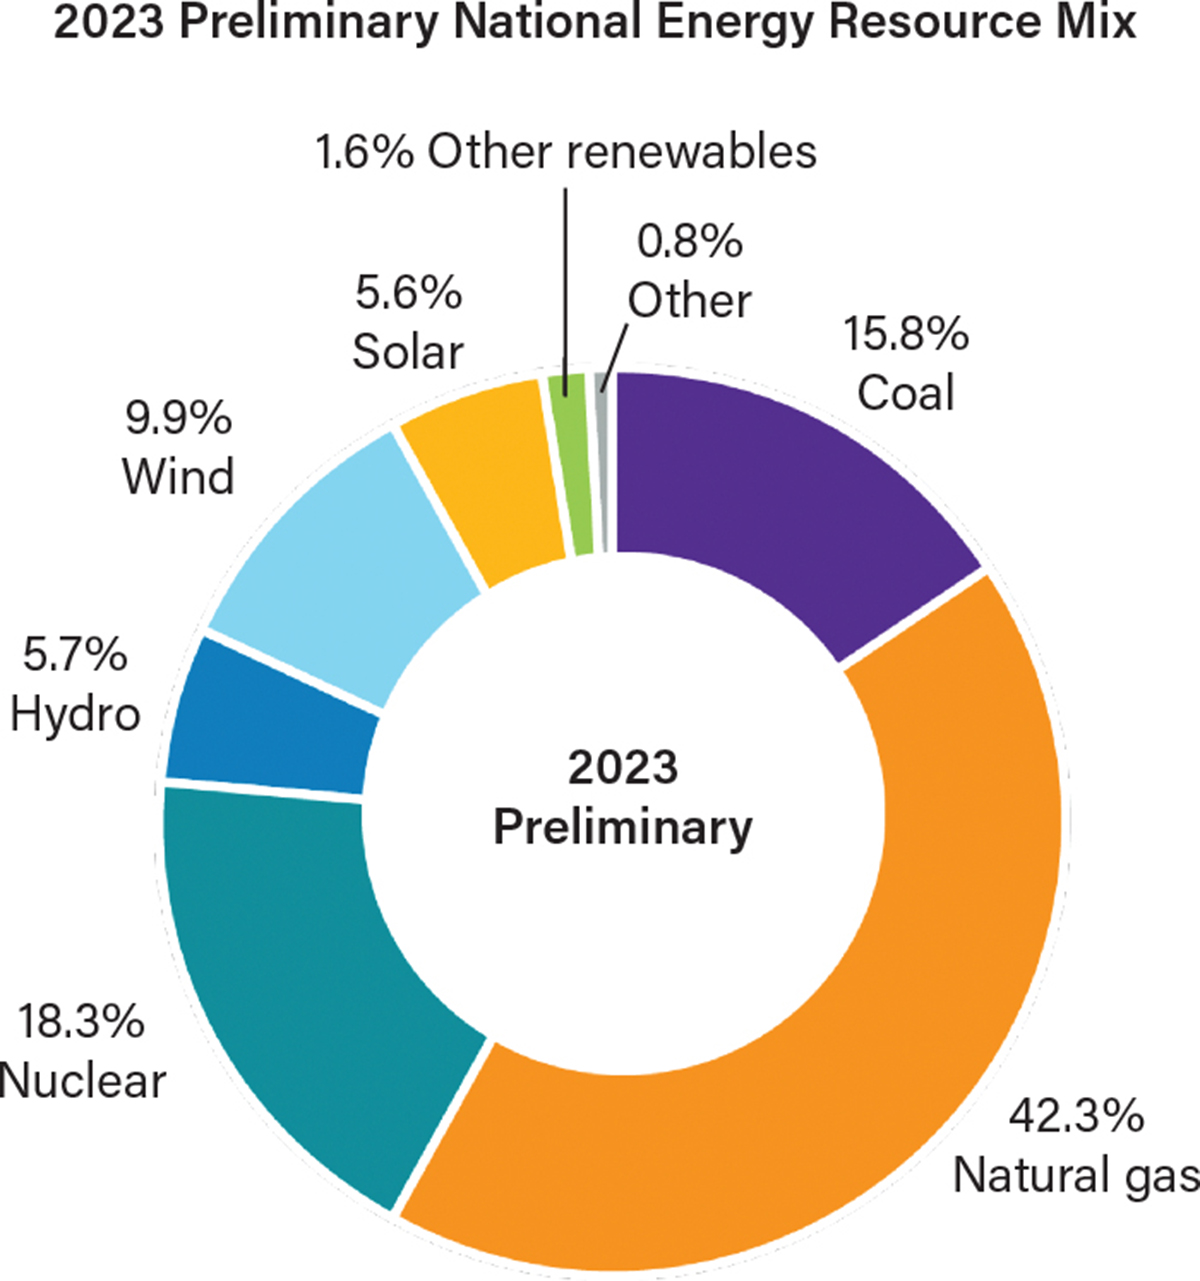
▲Figure 6. Electric utilities used a diverse mix of fuel resources to generate electricity in 2023. Scope 2 GHG emissions are based on the electrical generation portfolio of your local electric utility. Electricity generation consumes a significant amount of fossil fuels, which in turn contributes to the Scope 2 GHG emissions that your site must account for. Source: Adapted from (8).
Therefore, if you are consuming energy for processing chemicals, then you are producing GHG emissions and a carbon footprint. The next section explores how to decarbonize processes and reduce GHG emissions.
Reducing your GHG emissions
Since combustion and electricity consumption on your site contribute to your carbon footprint, organizations will want to understand the actual level of their carbon footprint, set goals, and explore ways to reduce it. This article focuses on the 4R’s of carbon footprint reduction: reduce, reuse, refuel, and redesign.
One method for setting carbon-reduction goals is to use the methodology outlined by the Science Based Targets initiative (SBTi) to set “science-based targets.”
“Science-based targets provide a clearly defined pathway for companies to reduce GHG emissions, helping prevent the worst impacts of climate change and future-proof business growth. Targets are considered ‘science-based’ if they are in line with what the latest climate science deems necessary to meet the goals of the Paris Agreement — limiting global warming to 1.5°C above pre-industrial levels” (10).
Once your targets are set, the 4 R’s of carbon footprint reduction will help you get started on your journey to meet your targets.
Figure 7 shows a graphic of the 4 R’s of carbon footprint reduction. We will discuss each one of these approaches individually in priority order for implementation.
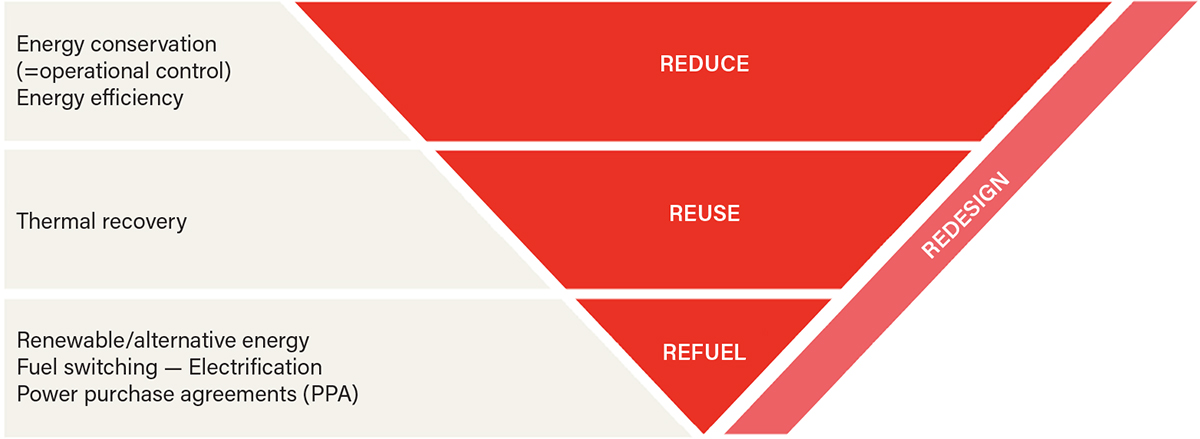
▲Figure 7. Managing your energy consumption and setting reduction targets for your associated energy-related GHG emissions is an excellent goal for all chemical industrial sites to adopt and work to achieve. The 4 R’s shown are an excellent way to get started.
Reduce. The best way to manage your carbon footprint is to manage your energy consumption. Therefore, the first and best step for reducing your carbon footprint is to reduce the amount of energy you consume. Gaining third-party certification in International Organization for Standardization (ISO) 50001 — Energy Management, implementing energy improvement projects, and using tools like energy treasure hunts, energy assessments, and the U.S. Dept. of Energy (DOE) 50001 Ready energy management tool can all significantly reduce energy consumption. Lower energy use means a smaller carbon footprint.
In addition, ensuring proper maintenance of combustion systems will also contribute to improved operational efficiency and energy savings. Tuning burners, changing filters, monitoring stack exhaust, controlling excess oxygen in combustion air, lubricating fans and motors, and other items can help to ensure that you are operating your combustion-based heat-treating processes as efficiently as possible.
Reuse. In a combustion process with 0% excess air and an exhaust gas temperature of 1,500°F, about 50% of the thermal energy goes right up the stack and heats the surrounding neighborhood (11). For example, the temperature of your exhaust stack gases is likely around 1,200–1,500°F, depending on the process. Consider whether there is an effective way to reuse this wasted heat for other processes in your facility. One of the best things to do with waste heat is to preheat the combustion air feeding the heating process. Here is a list of possibilities for reusing waste heat:
- space heating
- ingredient preheating
- hot water heating
- boiler feed water preheating
- combustion air preheating.
Refuel. Once you have squeezed all you can from reducing your process energy consumption and reusing waste heat, consider the possibility of switching the fuel source for the process. If you currently have a combustion process to provide heat for a process, is it practical or even possible to convert to electricity as the heating energy source? Electricity typically has less carbon emissions than your existing direct combustion processes on-site.
Switching heating energy sources is a complex process, and you must ensure that you maintain your process parameters and product quality. Typically, testing is required to ensure that the new electrical process will maintain the chemical properties and the quality standards that your customer specifications demand. Also, you will need a capital investment in new equipment to make this switch. Still, this method has significant potential for reducing carbon emissions and you should consider it where applicable.
Redesign. Finally, when the time is right, you can consider starting with a blank sheet of paper and completely redesigning your processes to be carbon-neutral. Redesign will likely mean a significant process change and capital investment. This would be applicable if you are adding a new process line or setting up a new manufacturing plant at a greenfield site.
From managing energy to managing carbon
The best way to manage and reduce your GHG emissions and associated carbon footprint is to manage your energy consumption by implementing an SEM program. Since your carbon footprint is directly proportional to your energy consumption, it only makes sense to have a strong SEM program in place to help you manage your carbon footprint.
Figure 8 shows a pyramid with a range of energy management programs. The key is to determine your organization’s point A and point B for your SEM journey. Every organization is different and has a unique SEM path based somewhere on this pyramid. Whether you are just starting to track your energy consumption or already ISO 50001- or Superior Energy Performance (SEP)-certified, programs and resources abound can help you start or continue with SEM.
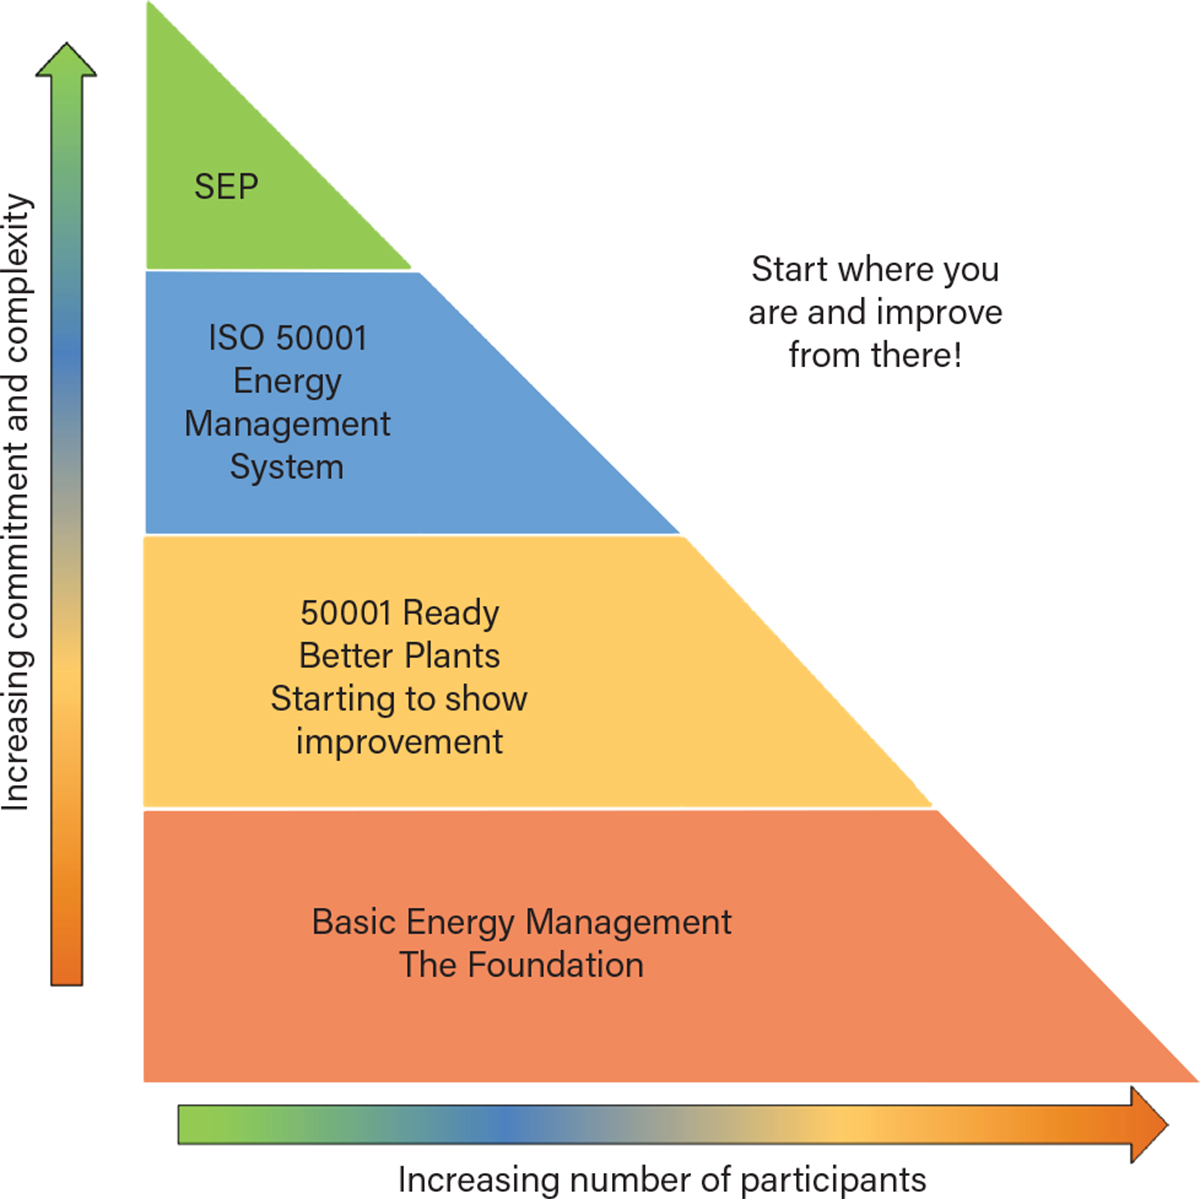
▲Figure 8. The key to efficient energy management is to decide where you are and where you want to go. The higher up the pyramid, the more rigorous the energy management processes.
Here is a list of SEM programs and resources that are readily available to help you on your SEM journey to eliminate GHG emissions and reduce your carbon footprint:
- ISO 50001 contains all the requirements to build a strong SEM program. ISO 50001 energy management programs are eligible for third-party certification (12).
- 50001 Ready is a practical implementation program based on the ISO 50001 standard. Lawrence Berkeley National Laboratory (LBNL) sponsors national 50001 Ready cohort training programs. The 50001 Ready program has also recently added guidance for decarbonization (13–15).
- The Better Buildings Programs and Partners system includes the Better Climate Challenge, the Better Buildings Challenge, and the Better Plants programs (16).
- The Energy and Emissions Intensive Industries program focuses on energy-intense industries and has a specific focus on the chemical and petrochemical manufacturing processes. This program is particularly applicable for chemical industrial organizations (17).
Any of these programs can help you start or continue your SEM journey. Remember, the best way to manage your carbon is to manage your energy.
Closing thoughts
If you consume energy, you will have energy-related GHG emissions to account for. Fossil fuel combustion and electricity consumption both contribute to your GHG emissions and carbon footprint. The best way to manage your carbon footprint is to have a strong, ongoing SEM program based on the principles of the ISO 50001 standard.
Literature Cited
- Lawrence Livermore National Laboratory, “Estimated U.S. Energy Consumption in 2021,” LLNL, https://flowcharts.llnl.gov/sites/flowcharts/files/2022-09/Energy_2021_United-States.pdf (Mar. 2022).
- U.S. Dept. of Energy, “Thermal Process Intensification: Transforming the Way Industry Uses Thermal Process Energy,” DOE Office of Energy Efficiency and Renewable Energy, Washington, DC (May 2022).
- Britannica, “Greenhouse Gas,” Britannica, https://www.britannica.com/science/greenhouse-gas (accessed Feb. 15, 2024).
- National Geographic Education, “Greenhouse Effect,” National Geographic, https://education.nationalgeographic.org/resource/greenhouse-effect/ (accessed Feb. 16, 2024).
- World Resources Institute, “The Greenhouse Gas Protocol: A Corporate Accounting and Reporting Standard, Revised Edition,” WRI, https://ghgprotocol.org/sites/default/files/standards/ghg-protocol-revised.pdf (Mar. 2004).
- U.S. Environmental Protection Agency, “Inventory of U.S. Greenhouse Gas Emissions and Sinks: 1990-2020,” EPA, https://www.epa.gov/ghgemissions/inventory-us-greenhouse-gas-emissions-and-sinks-1990-2020 (accessed Feb. 16, 2024).
- World Resources Institute, “The Greenhouse Gas Protocol: Corporate Value Chain (Scope 3) Accounting and Reporting Standard,” WRI, https://ghgprotocol.org/sites/default/files/standards/Corporate-Value-Chain-Accounting-Reporing-Standard_041613_2.pdf (Sept. 2011).
- Edison Electric Institute, “2023 National Energy Resource Mix,” U.S. Dept. of Energy, Energy Information Administration, https://www.eei.org/-/media/Project/EEI/Documents/Resources-and-Media/pie_national_resource_mix.pdf (accessed Feb. 16, 2024).
- U.S. Environmental Protection Agency, “Power Profiler,” EPA, https://www.epa.gov/egrid/power-profiler (accessed Feb. 16, 2024).
- Science Based Targets Initiative, “How it Works,” SBTi, https://sciencebasedtargets.org/how-it-works (accessed Feb. 16, 2024).
- U.S. Dept. of Energy, “Waste Heat Reduction and Recovery for Improving Furnace Efficiency, Productivity and Emissions Performance,” DOE Office of Energy Efficiency and Renewable Energy, Washington, DC (Nov. 2004).
- International Organization for Standardization, “Energy Management Systems, Requirements with Guidance for Use,” ISO 50001:2018, ISO, Geneva, Switzerland (Aug. 2018).
- Better Buildings, “5001 Energy Management Services,” U.S. Dept. of Energy, https://betterbuildingssolutioncenter.energy.gov/iso-50001/tools-expertise-training (accessed Feb. 16, 2024).
- Better Buildings, “5001 Ready Cohorts,” U.S. Dept. of Energy, https://betterbuildingssolutioncenter.energy.gov/sites/default/files/DOE_50001-Ready_Cohort.pdf (accessed Feb. 16, 2024).
- Lawrence Berkeley National Laboratory, “50001 Ready: Achieve Decarbonization Goals and Improve Energy Performance,” LBNL, https://50001ready.lbl.gov (accessed Feb. 16, 2024).
- Better Buildings, “Better Buildings Programs and Partners,” U.S. Dept. of Energy, https://betterbuildingssolutioncenter.energy.gov/partnerships (accessed Feb. 16, 2024).
- U.S. Dept. of Energy, “Energy- and Emissions-Intensive Industries,” DOE Office of Energy Efficiency and Renewable Energy, https://www.energy.gov/eere/iedo/energy-and-emissions-intensive-industries (accessed Feb. 16, 2024).

Copyright Permissions
Would you like to reuse content from CEP Magazine? It’s easy to request permission to reuse content. Simply click here to connect instantly to licensing services, where you can choose from a list of options regarding how you would like to reuse the desired content and complete the transaction.