
-

-
Topics:
This is part 3 of a 6 part series on the Economics of Engineering. Part III - Financial Statements (Balance Sheet)
Each year, public corporations mail out annual reports to every stockholder, chock full of tables, graphs, and various other sundry information. What does it all mean?
The cornerstone of a public company's financial success is the annual report. Wall Street investors, stockholders, executives, and employees are all interested in periodic reports that present a snapshot view of the financial health of the organization, as well as trends of growth or improvement over time. Since these periodic reports tend to drive stock prices up or down, and since your boss' bonus is based on the value of the company's stock, he or she is of course interested in how your project will contribute to the bottom line! In a previous post, we looked at the Time Value of Money, including measures such as the expected Net Present Value. With discount factors, projects are viewed through the lens of which alternatives to choose, what might the future look like if we choose to invest in this project vs. another one? With a strict accounting view of Financial Statements, analysts (and your boss) will evaluate past performance. The primary "material balance" for money is:
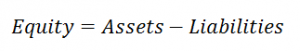
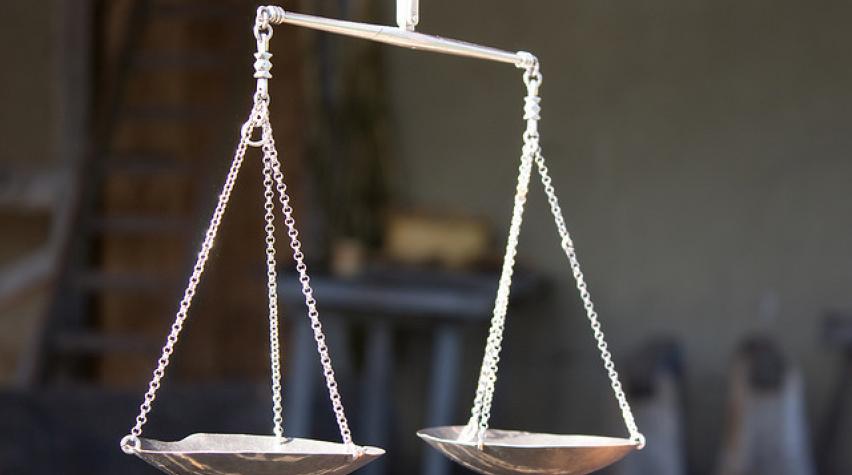
A Balance Sheet shows this information as a snapshot in time, on the last day of the accounting period, such as 31 December 2009. Assets represent valuable contributions to the business, such as cash, plant equipment, property, vehicles, accounts receivable, and similar items. Liabilities represent what is owed to creditors, such as accounts payable, short-term loans, long-term loans, and income tax payable to the government. Shareholder Equity, the remainder of assets minus liabilities, then is the investment in the company that people have made through purchases of stock or profits that are held in the company not yet paid out, called Retained Earnings. When a company makes a profit, in cash for example, but does not use the cash to pay down other liabilities, these monies are held in the Retained Earnings account and may be later paid out as an optional Dividend to stockholders. Essentially retained earnings serve to re-invest profit in the company. Looking at the balance sheet in detail, popular measures of a firm's viability are the Current Ratio, Working Capital, and the P/E Ratio ("p to e").

- Current Ratio looks at the amount of current assets (cash and those assets which are easily converted to cash such as accounts receivable) relative to current liabilities (short-term debt and accounts payable, for example) to determine if the company can readily pay off the liabilities that are "currently" due. It is desirable for a firm to have a current ratio of 2:1.
- Working Capital is a measure of how the company's liquidity. This is a similar measure to the current ratio, but is focused on only cash, or the most liquid of the current assets. Working Capital gives investors a picture of whether the business can pay its employees (you!) and its other immediate financial obligations.
- Banks will examine a company's working capital in order to determine whether they will offer a loan. So, for your personal finances, banks will look at your salary and other sources of income less the amount of your mortgage and other bills (credit cards, car loans, etc.) as a measure of your personal working capital.
- P/E Ratio is the "price-to-earnings" ratio and represents the price of the firm's current stock price divided by the earnings per share. Theoretically, this unitless number tells how much an investor is willing to pay for the company's stock. If a company's stock has a P/E ratio of 15, then the stock is currently selling for 15 times the company's earnings. The P/E ratio is a reflection of an industry's growth prospects, so if Company Z has a higher P/E ratio than Company A, investors believe that Company Z will outperform Company A so they are willing to pay a higher price for a share of Company Z's stock.
Let's look at an example. Company X has Current Assets of $510,000 in 2009 and Current Liabilities of $80,000. (Note that
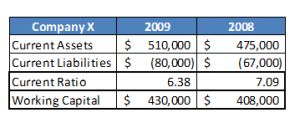
accountants and bookkeepers show negative numbers in parentheses.) Dividing $80,000 into $510,000 we get 6.38. You might think that a large number for the Current Ratio is good, but it might mean that the Company X is holding too much cash, accounts receivable, or unsold products as inventory. Historically, a Current Ratio of 2.0 was considered "healthy" yet today many companies strive to maintain a Current Ratio of 1.0. We will note that the amount of Working Capital at Company X has increased by $22,000 between 2008 and 2009, indicating that the firm has more current assets available to pay off current liabilities. However, if the primary increase in current assets is inventory (possible during a recession) then the company's liquidity could be in danger because it is sometime hard to convert unsold products into cash.
What other questions would you ask about Company X based on this Balance Sheet information?
Besides just a snapshot in time, you might want to know more about the company's income and profits for the past year.
Can a firm have a healthy Balance Sheet but lack Income?
We'll address these questions in the next blog post. In the meantime, let me know what you think.