2022 Annual Meeting
(588h) Process Monitoring Optimization Via Unsupervised Clustering Metrics
Authors
Automation of method selection and tuning could improve plant operatorsâ ability to deploy FDD strategies in real industrial settings. This could be achieved by casting the task of method selection and tuning as an optimization problem, in which the choice of methods and values for the hyperparameters are the decision variables. However, the definition of the objective function for this optimization problem is not straight-forward since, being this an unsupervised learning task, there are no ground truth labels to evaluate the accuracy of a given ensemble. Hence, alternative performance measures should be considered if an optimization approach is to be implemented. One possible way to overcome this issue is to implement unsupervised clustering metrics (UCMs). UCMs use information about the samples within the clusters as well as their relationship with samples in other clusters to estimate how well the clustering method captures the underlying patterns in the data. Three representative examples of these metrics are the silhouette score (S-score)[1], the Davies-Bouldin Index (DBI)[2], and the Calinski-Harabasz Index (CHI)[3]. Although these metrics provide some level of information about the extent to which a given clustering method captures the underlying distribution of the data, their applicability is heavily dependent on the nature of the data being analyzed. Thus, this work aims to evaluate the applicability of these metrics for FDD in chemical process data. Four steps in the FDD workflow and their corresponding method selection and hyperparameter tuning were considered: data preprocessing, dimensionality reduction, clustering and classification.
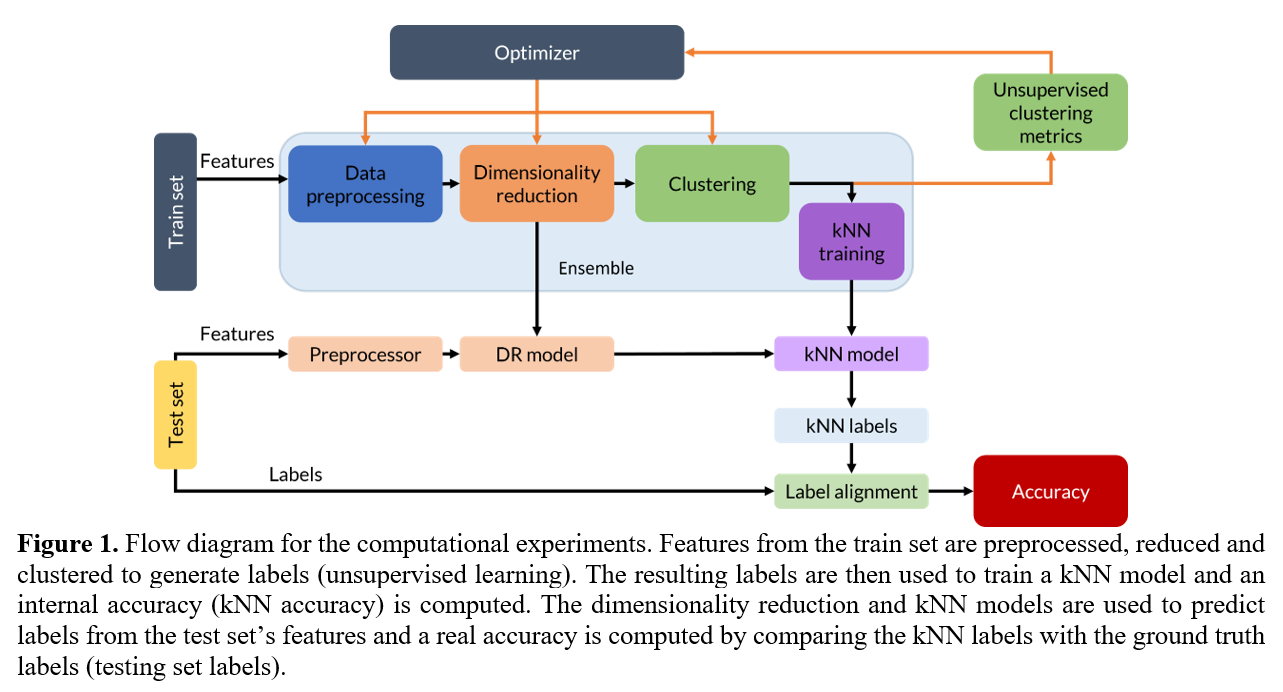
Figure 1 shows the overarching methodology for the computational experiments. Three alternatives for dimensionality reduction PCA[10], UMAP[11], no DR; and three alternatives for clustering KMEANS[10], DBSCAN[10], HDBSCAN[8]; coupled with kNN[12,13] are investigated. Additionally, three scaling methods (z-score, over mean, over min-max) were evaluated. Decision variables were method selection, methodsâ hyperparameters, and preprocessing method. Computational experiments were carried out using labeled data in order to contrast unsupervised clustering metrics against accuracy. Simultaneously, the accuracy against the ground truth labels is evaluated and recorded to evaluate the ensembleâs performance. Since the clustering that will be learned by the kNN model was obtained in an unsupervised fashion, the labels assigned to the test set could be named differently than the ground truth label; an automatic procedure was developed to align the labels predicted by the ensembles with the ground truth labels.
An evolutionary algorithm (EA) was selected for the optimization of the ensembles. EAs have been shown to perform well for multi-objective hyperparameter optimization of machine learning models[14,15]. Here, the selection of hyperparameters for each ensemble is cast as a Mixed Integer Nonlinear Programming problem and solved using the Non-dominated Sorting Genetic Algorithm (NSGA-II)[16], as implemented by Pymoo[17]. Additional details on NSGA-II and its implementation for hyperparameters tuning can be found elsewhere[15,17]. A population size of 10 and offspring of 5 was used in all cases.
Analyses were carried out with two different datasets: a simulated dataset from the Tennessee Eastman Process (TEP) and an industrial dataset from a pyrolysis reactor. TEP is a realistic, well-defined simulation with five unit operations (a reactor, condenser, separator, compressor, and stripper) that models four gaseous reactants competing in several reactions to produce two liquid products as well as an unwanted byproduct in the presence of an inert[18]. The second set of data analyzed in this work is from an industrial pyrolysis reactor, which is a well-known industrial process unit that cracks heavy hydrocarbons into higher-value, lower molecular weight hydrocarbons. Additional details about his process can be found elsewhere[12].
Results for two simulated data sets and one industrial dataset showed that optimization of hyperparameters is possible and that this framework enables the fast exploration of ensembles and direct comparison, which is a useful tool for the exploration of plant data. In general, the number of clusters needed to represent the data distribution increases exponentially as the accuracy approaches 100%. However, reasonable accuracies can be obtained with fewer clusters. The effectiveness of unsupervised clustering metrics was explored by observing their evolution with accuracy during optimization. Results showed that Silhouette score and Davies-Boulding index are strong predictors of the ensembleâs performances in the fault diagnosis task. For the Calinski-Harabasz index results are inconclusive. S-score and DBI were used for the optimization of ensembles for the industrial dataset (pyrolysis reactor) and it was shown that good initial results for the fault diagnosis task can be achieved in the absence of labeled data.
References
[7] A.K. Jain, R.C. Dubes, Algorithms for clustering data, (1988).