
-
 by Noel Sutton
 -
Topics:

A number of experimental designs have been developed to help scientists understand cause-and-effect relationships between parameters in complex systems. Variables Search is a very effective troubleshooting technique developed by Dorian Shainin, recipient of four major ASQ awards. Keki Bhote describes Variables Search and other Shainin problem-solving methods in World Class Quality: Using Design of Experiments to Make It Happen. Variables Search has several benefits compared to other experimental designs:
- Much easier to learn and use
- You quickly find out whether key parameters have been accounted for or overlooked
- Relatively few experiments are required to pinpoint the critical variables. This is extremely important because experimentation is costly and time-consuming.
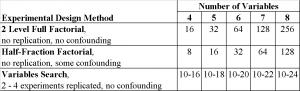
- "Confounded" variables, where a scientist cannot determine whether a given response is due to a multivariable interaction or a single variable, is an issue with many Design of Experiment (DOE) techniques, e.g., fractional factorials, Taguchi orthogonal arrays, Plackett-Burman designs. Variables Search clearly dissociates the main and interaction effects from each other.
- Some conditions are replicated, which helps assess experimental error
Variables Search Phase 1 - Determine whether the critical variables have been uncovered
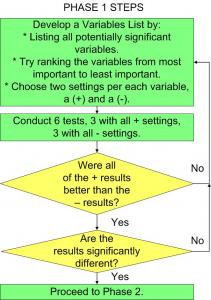
Referring to the Phase 1 flowchart, several guidelines should be kept in mind while creating a "Variables List":
- Selecting Variables: It's better to include seemingly irrelevant variables on the list, rather than omitting them, in case those variables turn out to be significant.
- Ranking Variables: While variables can be ranked arbitrarily, there's a benefit associated with placing the most influential variables highest on the list. Variables ranked highest will be examined first during Phase 2; consequently, the number of experiments will be reduced if this activity was done effectively.
- Choosing Settings: Each (+) value should be chosen with the belief that it will lead to the desired outcome, while each (-) value should be selected with the thought it will lead to an unwanted result.
When carrying out the six tests mentioned in the Phase 1 flowchart, randomize these experiments to ensure that uncontrolled variables do not bias the results. A test design example for six variables is displayed in the table below.
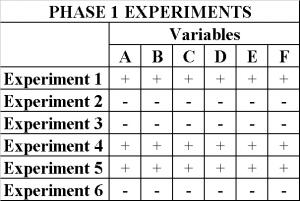
To verify you're on the right track, I recommend doing two experiments up front; one experiment with all variables set at their (+) values, the other with all variables set at their (-) levels. Did the (+) settings experiment achieve the desired effect, while the (-) settings lead to an adverse response? If not, then the Variables List must be revised. Either:
- Reexamine the Variables List. Should more variables be added to the list?
- It's possible the (+) and (-) levels of one or more variables were assigned incorrectly and they're canceling the influence of other variables. Should any (+) and (-) values be reassigned?
If necessary, repeat the initial set of experiments until the (+) settings lead to a good outcome and the (-) settings leads to a poor result. Once this occurs, carry out the four remaining Phase 1 experiments.
Examining the results, answer the two questions posed on the Phase 1 flowchart. To establish a 95% confidence level that the critical variables have indeed been uncovered, both questions must be answered "yes."
Variables Search Phase 2 - Pinpoint the critical variables
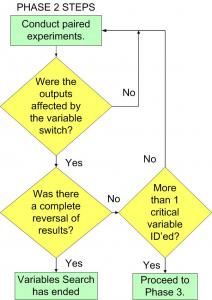
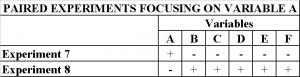
Phase 2 consists of a series of paired experiments to screen variables for their significance. This is done by swapping the (+) and (-) values of one variable at a time. By keeping all other variables at the conditions established during the Phase 1 experiments, the effect of the changed variable is highlighted. The order of these variable swapping experiments should be based upon the ranking done in Phase 1. The first set of paired experiments is depicted in the table below.
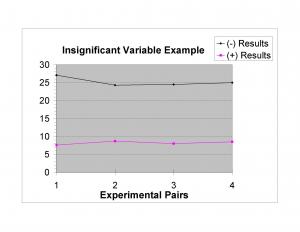
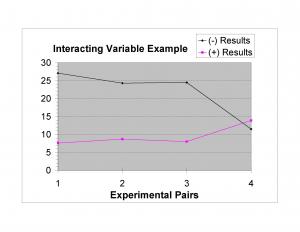
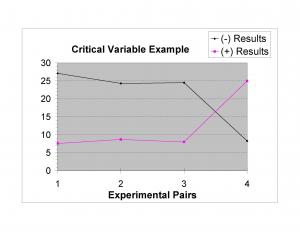
These paired experiments have three possible outcomes:
- The response variable is not affected at all when the variable under study is switched. This indicates that particular variable is insignificant within the range of conditions tested.
- The outputs change somewhat. This means the variable being studied is significant and it is interacting with other variables.
- There is a complete reversal of outputs. This means the switched variable is the one and only critical variable.
Continue with the paired experiments per the Phase 2 flowchart until one or more significant variables have been identified.
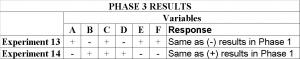
Variables Search Phase 3 - Confirm that every interacting variable has been identified
Once two interacting variables have been identified during Phase 2, a pair of experiments must be completed to confirm that only those variables are interacting. The (+) and (-) settings of these two variables must both be switched from conditions established during Phase 1. In the table below, Variables B and D are switched. If, as indicated, the results reverse completely, all interacting variables have been identified and no further experimentation is necessary. If this is not the case, return to Phase 2 to identify another key parameter and then repeat the Phase 3 confirmation experiments.
To quantify the influences of individual variables in a multi-variable interaction, experimental results can be analyzed by various software programs that perform Analysis of Variance (ANOVA) calculations, or the Yates algorithm can be employed to manually calculate each variable's effects.