
Page 257 - CHEF Guide
P. 257
Likelihood Evaluation
A proximity-based Probability of Personnel Presence was covered under Impact Assessment.
Some plant operations have potential for harm only during discrete periods of time. For example, a batch plant
may manufacture a number of different products using the same equipment but only one product uses hazardous
chemicals. The Time at Risk divided by the total time may represent an Enabling Condition probability that reduces
the overall likelihood of a scenario.
A Conditional Modifier is one of several possible probabilities included in scenario risk calculations, generally when
risk criteria endpoints are expressed in impact terms (e.g., fatalities) instead of in primary loss event terms (e.g., release,
vessel rupture). Conditional modifiers include but are not limited to: probability of a hazardous atmosphere, probability of
ignition, probability of explosion, probability of personnel presence, probability of injury or fatality, and probability of
equipment damage or other financial impact.
Conditional Modifiers are additional probabilities included in scenario risk calculations. Ignition of a flammable release
is a common Conditional Modifier. The Probability of Ignition for an outdoor release is often based on the size of the cloud
and likelihood the cloud reaches one or more ignition sources.
Enabling Conditions and Conditional Modifiers are discussed in greater detail in Section 16 Layers of Protection
Analysis.
15.10 Fault Tree Likelihood Modeling
When the failure rate for a system or group of components (such as a process control loop) is not available from plant
history, an estimate may be needed. Fault Tree modeling is commonly used to estimate failure frequency or Probability of
Failure on Demand. Event Tree modeling is used to evaluate all outcomes from an undesired event or loss event.
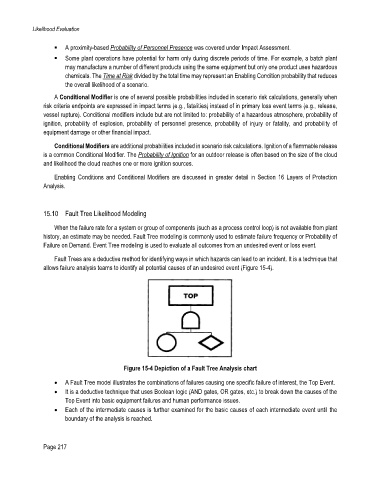
Fault Trees are a deductive method for identifying ways in which hazards can lead to an incident. It is a technique that
allows failure analysis teams to identify all potential causes of an undesired event (Figure 15-4).
Figure 15-4 Depiction of a Fault Tree Analysis chart
A Fault Tree model illustrates the combinations of failures causing one specific failure of interest, the Top Event.
It is a deductive technique that uses Boolean logic (AND gates, OR gates, etc.) to break down the causes of the
Top Event into basic equipment failures and human performance issues.
Each of the intermediate causes is further examined for the basic causes of each intermediate event until the
boundary of the analysis is reached.
Page 217