
Page 252 - CHEF Guide
P. 252
Likelihood Evaluation
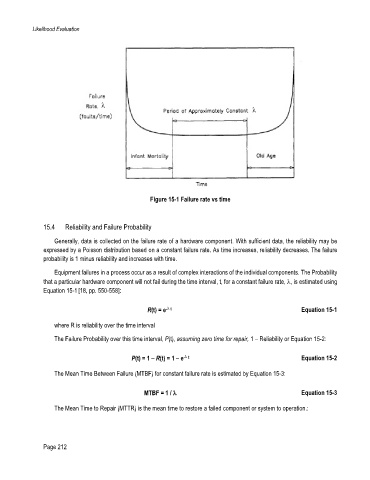
Figure 15-1 Failure rate vs time
15.4 Reliability and Failure Probability
Generally, data is collected on the failure rate of a hardware component. With sufficient data, the reliability may be
expressed by a Poisson distribution based on a constant failure rate. As time increases, reliability decreases. The failure
probability is 1 minus reliability and increases with time.
Equipment failures in a process occur as a result of complex interactions of the individual components. The Probability
that a particular hardware component will not fail during the time interval, t, for a constant failure rate, , is estimated using
Equation 15-1[18, pp. 550-558]:
R(t) = e - t Equation 15-1
where R is reliability over the time interval
The Failure Probability over this time interval, P(t), assuming zero time for repair, 1 – Reliability or Equation 15-2:
P(t) = 1 – R(t) = 1 – e - t Equation 15-2
The Mean Time Between Failure (MTBF) for constant failure rate is estimated by Equation 15-3:
MTBF = 1 / Equation 15-3
The Mean Time to Repair (MTTR) is the mean time to restore a failed component or system to operation.:
Page 212