
Page 212 - CHEF Guide
P. 212
Vapor Dispersions
The estimated concentration at 200 m will use the neutrally buoyant equation at an equivalent distance of:
xb = x – xt + xv = 200 – 120.6 + 25.7 = 105.1 m
Cm = 0.0724 (105.1 m) -1.61 = 105.1 m = 0.0000403 volume fraction or 40.3 ppm by volume
Note that this estimated concentration at 200 m downwind distance is significantly less than predicted by only the
dense gas model (162 ppmv) and significantly more than predicted by only the neutrally buoyant model (14.3 ppmv).
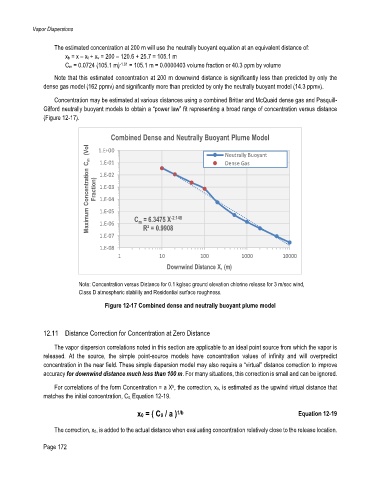
Concentration may be estimated at various distances using a combined Britter and McQuaid dense gas and Pasquill-
Gifford neutrally buoyant models to obtain a “power law” fit representing a broad range of concentration versus distance
(Figure 12-17).
Combined Dense and Neutrally Buoyant Plume Model
(Vol 1.E+00 Neutrally Buoyant
Maximum Concentration C m Fraction) 1.E-02
1.E-01
Dense Gas
1.E-03
1.E-04
1.E-05
m
1.E-06
R² = 0.9908
1.E-07 C = 6.3475 X -2.148
1.E-08
1 10 100 1000 10000
Downwind Distance X, (m)
Note: Concentration versus Distance for 0.1 kg/sec ground elevation chlorine release for 3 m/sec wind,
Class D atmospheric stability and Residential surface roughness.
Figure 12-17 Combined dense and neutrally buoyant plume model
12.11 Distance Correction for Concentration at Zero Distance
The vapor dispersion correlations noted in this section are applicable to an ideal point source from which the vapor is
released. At the source, the simple point-source models have concentration values of infinity and will overpredict
concentration in the near field. These simple dispersion model may also require a “virtual” distance correction to improve
accuracy for downwind distance much less than 100 m. For many situations, this correction is small and can be ignored.
For correlations of the form Concentration = a X , the correction, x0, is estimated as the upwind virtual distance that
b
matches the initial concentration, C0, Equation 12-19.
x0 = ( C0 / a ) 1/b Equation 12-19
The correction, x0, is added to the actual distance when evaluating concentration relatively close to the release location.
Page 172