
Page 25 - Effectively using metrics
P. 25
Appendix - Table of Key Metrics Linking Leading Metrics to
Risk Based Process Safety (RBPS)
The table included in this appendix lists key leading process safety metrics. The metrics were
extracted from the following sources.
CCPS Process Safety Leading Indicators Industry Survey (CCPS, 2013) - Noted in table as
“C”
IChemE Safety Centre Guidance Leading Process Safety Metrics – selecting, tracking and
learning (IChemE Safety Centre, 2015) - Noted in table as “I”
IOGP Process safety – Recommended practice on Key Performance Indicators, R456
(IOGP, 2018) - Noted in table as “G”
Leading metrics should strive to address the process safety management system element
issues at the root of process safety incidents by changing human actions to better support
or improve that management system performance.
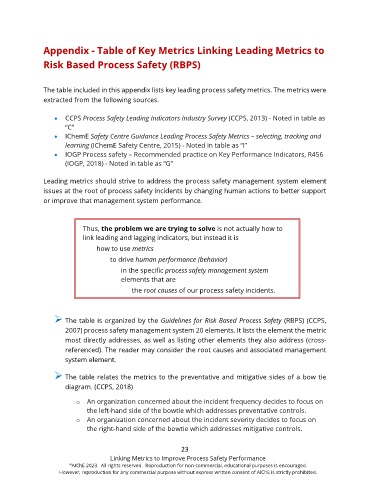
Thus, the problem we are trying to solve is not actually how to
link leading and lagging indicators, but instead it is
how to use metrics
to drive human performance (behavior)
in the specific process safety management system
elements that are
the root causes of our process safety incidents.
The table is organized by the Guidelines for Risk Based Process Safety (RBPS) (CCPS,
2007) process safety management system 20 elements. It lists the element the metric
most directly addresses, as well as listing other elements they also address (cross-
referenced). The reader may consider the root causes and associated management
system element.
The table relates the metrics to the preventative and mitigative sides of a bow tie
diagram. (CCPS, 2018)
o An organization concerned about the incident frequency decides to focus on
the left-hand side of the bowtie which addresses preventative controls.
o An organization concerned about the incident severity decides to focus on
the right-hand side of the bowtie which addresses mitigative controls.
23
Linking Metrics to Improve Process Safety Performance
AIChE 2023. All rights reserved. Reproduction for non-commercial, educational purposes is encouraged.
However, reproduction for any commercial purpose without express written consent of AIChE is strictly prohibited.