
Page 141 - CHEF Guide
P. 141
Hazard Evaluation Techniques
8.17 Other Hazard Identification Methods
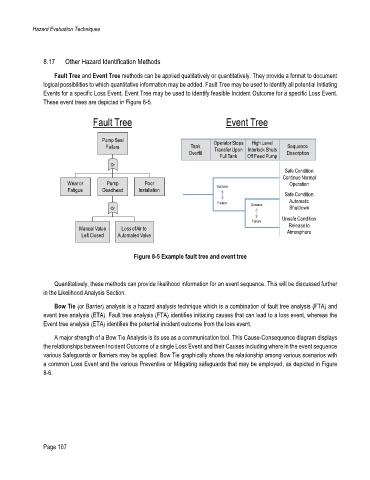
Fault Tree and Event Tree methods can be applied qualitatively or quantitatively. They provide a format to document
logical possibilities to which quantitative information may be added. Fault Tree may be used to identify all potential Initiating
Events for a specific Loss Event. Event Tree may be used to identify feasible Incident Outcome for a specific Loss Event.
These event trees are depicted in Figure 8-5.
Fault Tree Event Tree
Pump Seal Operator Stops High Level
Failure Tank Transfer Upon Interlock Shuts Sequence
Overfill Description
Full Tank Off Feed Pump
Or
Safe Condition
Continue Normal
Wear or Pump Poor Operation
Fatigue Deadhead Installation Success
Safe Condition
Automatic
Failure Success
Or Shutdown
Unsafe Condition
Failure
Release to
Manual Value Loss of Air to Atmosphere
Left Closed Automated Valve
For Illustration Only – these diagrams do not reflect complete results
Figure 8-5 Example fault tree and event tree
Quantitatively, these methods can provide likelihood information for an event sequence. This will be discussed further
in the Likelihood Analysis Section.
Bow Tie (or Barrier) analysis is a hazard analysis technique which is a combination of fault tree analysis (FTA) and
event tree analysis (ETA). Fault tree analysis (FTA) identifies initiating causes that can lead to a loss event, whereas the
Event tree analysis (ETA) identifies the potential incident outcome from the loss event.
A major strength of a Bow Tie Analysis is its use as a communication tool. This Cause-Consequence diagram displays
the relationships between Incident Outcome of a single Loss Event and their Causes including where in the event sequence
various Safeguards or Barriers may be applied. Bow Tie graphically shows the relationship among various scenarios with
a common Loss Event and the various Preventive or Mitigating safeguards that may be employed, as depicted in Figure
8-6.
Page 107