(676e) Improved Particle Characterisation from in-Line PAT: Comparison of Deep Learning and White-Box Methods
AIChE Annual Meeting
2022
2022 Annual Meeting
Separations Division
PAT and Process Monitoring in Crystallization Development and Manufacturing
Thursday, November 17, 2022 - 5:29pm to 5:58pm
In-line Process Analytical Technologies (PAT) are useful for measurement of particle characteristics (e.g. particle size distribution, PSD) in a non-destructive manner and with high time resolution inaccessible with off-line techniques. These measurements can be useful for process monitoring and accurate population balance modelling.
This work is concerned with assessing the performance of using in-line image and chord length distribution (CLD) analysis for PSD measurement. Imaging is obtained through in-line microscopy (e.g. BlazeMetrics’ Blaze 400, or Mettler Toledo’s Particle Vision and Measurement, PVM), while CLD can be obtained via light-scattering methods (e.g. Mettler Toledo’s Focused Beam Reflectance Measurement, FBRM). Sensor data is analysed through different methods to yield PSDs. Traditional white-box (i.e. not machine learning) analyses can involve length “tuning†steps wherein the analysis is adapted to work with the system (Cardona et al. 2018), or are derived mathematically and are restricted to a small domain (Agimelen et al. 2015). Despite these drawbacks, these techniques are demonstrably effective, once tuned or when applied to the appropriate domain. Deep learning (black box) models have potentially increased performance and flexibility over white box techniques. This is in part due to their large number of parameters and due to modern breakthroughs in model design (He et al. 2017). Deep learning models are widely used in image analysis, with further applicability to other domains such as CLD transformation.
Different PAT sensors perform differently under different conditions. For image-based measurement: small particles may not be measurable with great accuracy due to resolution issues, concentrated systems will impact measurement of the particles due to particle overlaps, and large particles are more likely to interact with the edge of the image field of view and therefore are less likely to be sized resulting in left-skewed PSDs. For FBRM-based measurements: translucent particles cause a phenomenon called “chord splitting†wherein a single chord is mis-registered as multiple smaller chords resulting in modes appearing at lower bins than expected on the PSD. In addition, low concentration systems (small number of particles) can result in few counts in the CLD and present as noise and thus impacting the transformation from CLD to PSD.
Methods
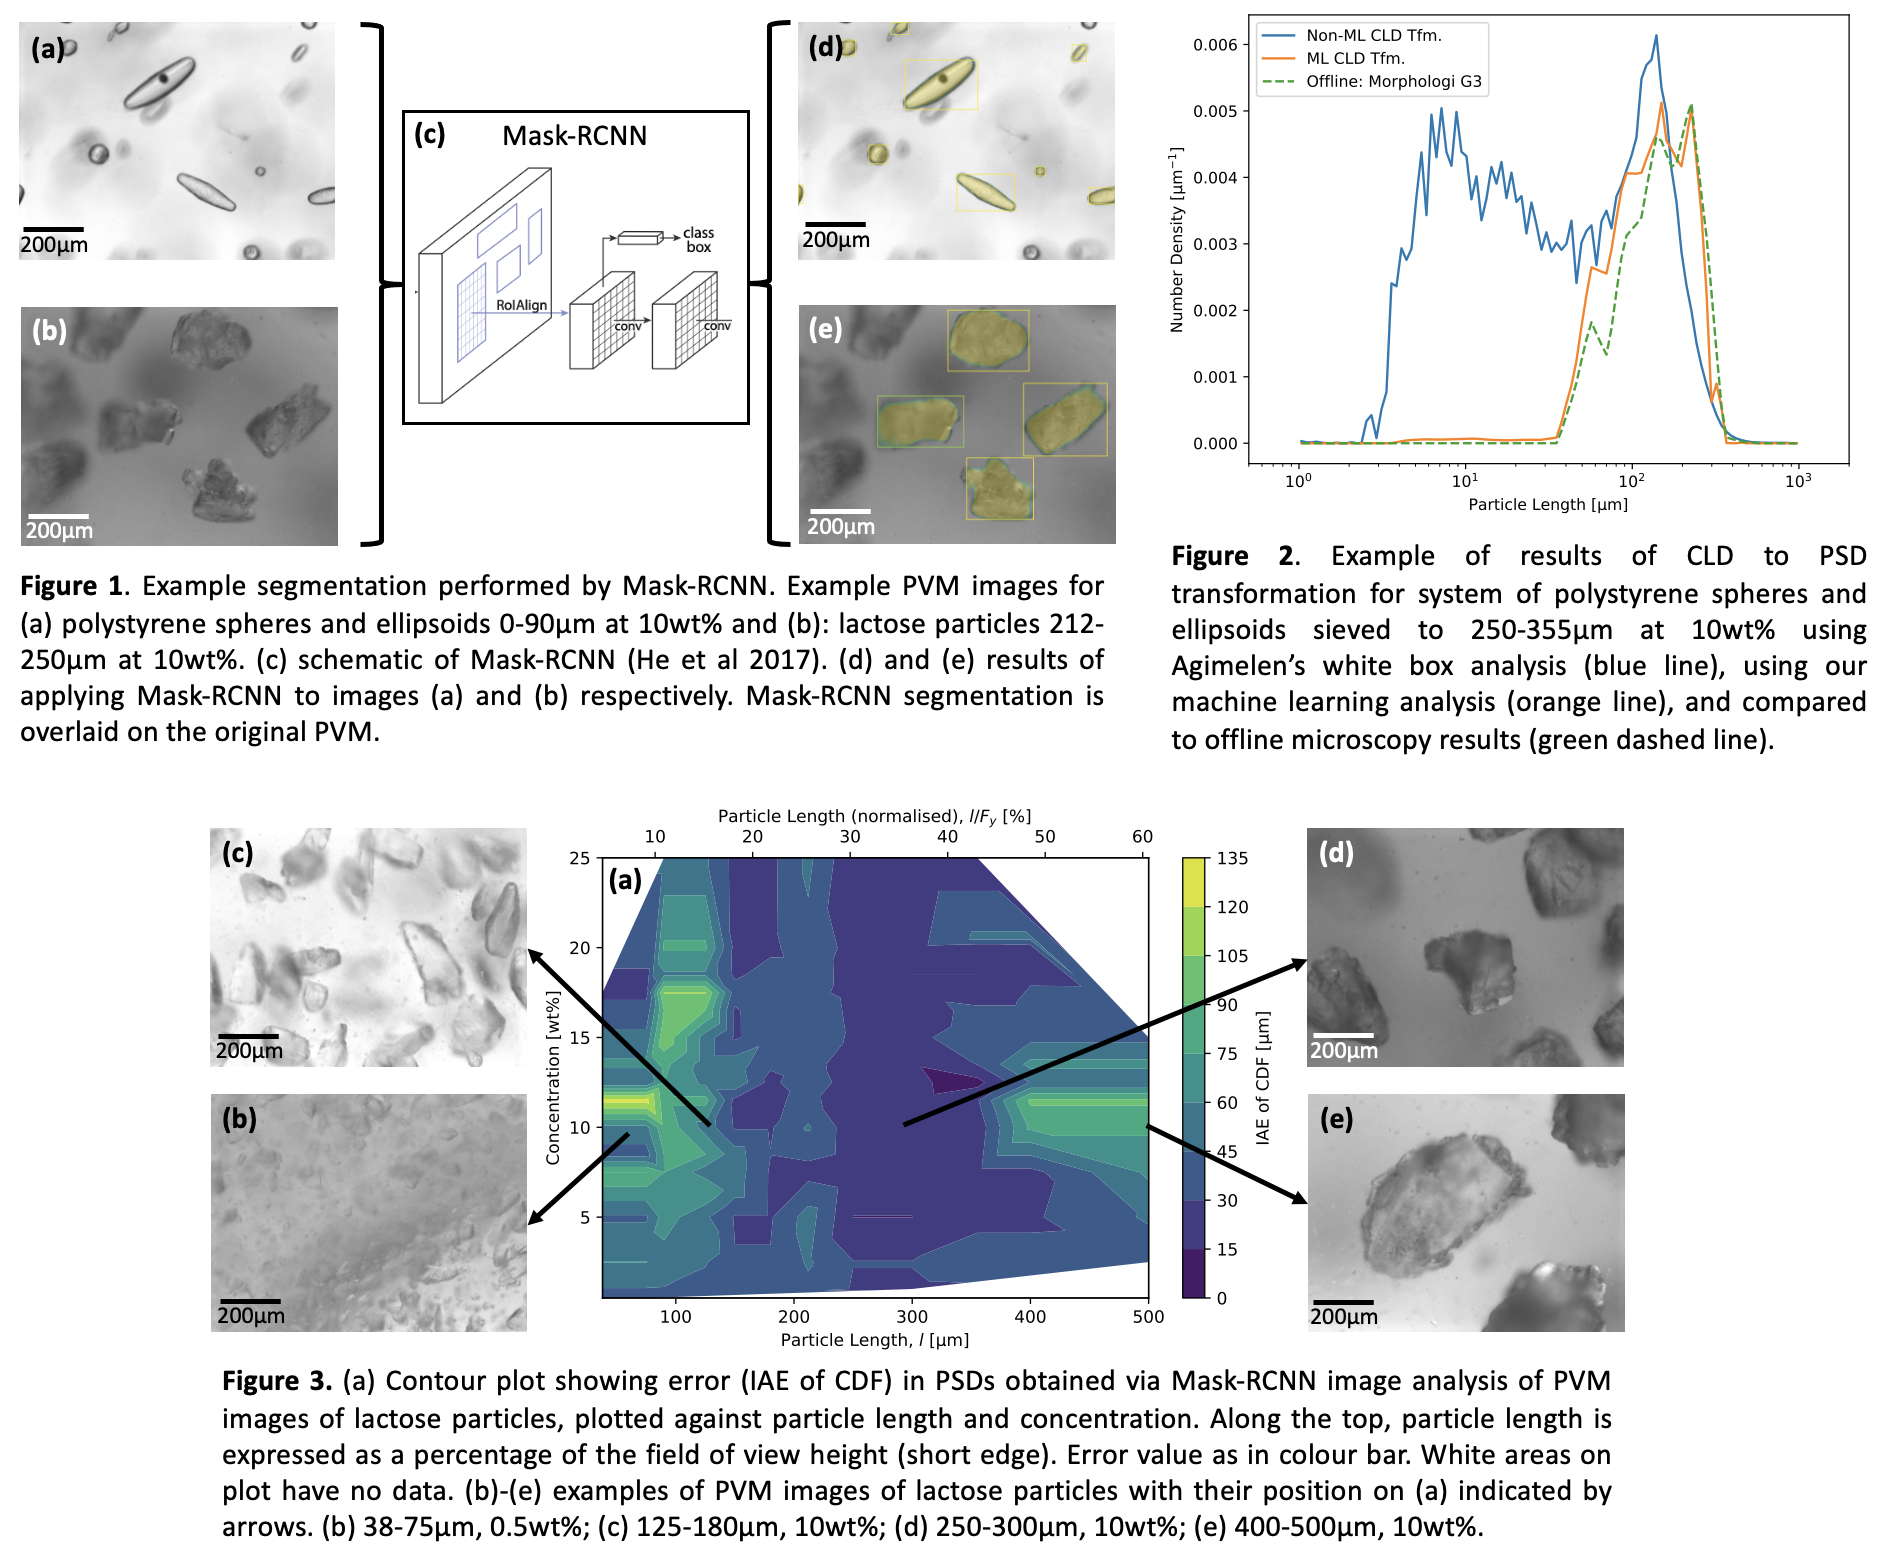
In-line measurements were taken with the Mettler Toledo FBRM G400 (CLD) and PVM V819 (Imaging) probes of Polystyrene Standard Spheres (PolyS), a mixture of Polystyrene Spheres and Ellipsoids (PolyE), and of Lactose particles (Figure 3, (b)-(e)). In-line-derived PSDs from a range of crystal sizes and concentrations were compared with a ground truth either from off-line microscopy (PolyE, Lactose) or from manufacturer specifications (PolyS).
Two image analysis methods were employed. The first is a traditional approach (ImagingApp (Cardona et al.2018)) wherein a grayscale image is converted (in a process called segmentation) to a black and white mask (black pixels representing background and white being part of a particle) by applying edge detection and binarising filters. The second image analysis is a machine learning approach. We used the Detectron 2 (Wu et al. 2019) framework to train a Mask-RCNN (He et al. 2017) image segmentation model. The model was used pre-trained on the Common Objects in COntext (COCO) dataset and fine-tuned on a dataset composed of examples of PVM images from each system (PolyS, PolyE, Lactose) annotated to identify particles. Images are segmented (Figure 1) to find particles, which are sized by fitting a rotated rectangle. Sizes are collected, histogrammed, and normalised to yield the number density particle size distribution.
Mirroring image analysis, two CLD analyses are employed: a white-box approach and a black-box approach. The white-box approach (Agimelen et al. 2015) relies on a probabilistic model. The probabilistic model yields a transformation matrix for the forward problem of converting a PSD to its CLD. The inverse problem is complicated as the matrix is singular. An optimisation scheme is employed to search for the PSD most likely to correspond to the given CLD. A machine learning approach is also employed, using a model based on the popular ResNet (He et al. 2015) model used widely in image analysis. This model is trained on a subset of the measured CLD (PolyS, PolyE, Lactose) linked with offline-microscopy-derived PSDs (Morphologi G3). An example of applying these approaches is shown on Figure 2.
This gives four tools for obtaining PSDs: two analyses for each of two sensors, a sensor and analysis combination constitutes a “toolâ€. In order to choose between tools, they need to be evaluated.
Tool evaluation is performed by comparing PSDs obtained using each tool with ground truth PSDs obtained from offline microscopy (for PolyE, Lactose) or manufacturer specification (for PolyS). Comparison is made through use of two metrics (distance functions): Root Mean Square Error (RMSE) and Integral Absolute Error of Cumulative Density Function (IAE of CDF). The RMSE metric (square root of the mean of the square difference in two PSDs) is well known and commonly used, however it saturates for large discrepancies in PSDs making it only suitable where the two inputs have some crossover. The second metric in use is the CDF of IAE, related to the Wasserstein Distance, and defined as the integral of the absolute error between the cumulative sum of the input PSDs. IAE of CDF gives an indication of how different two PSDs are but, importantly, the measure does not saturate.
Results and Discussion
Statistical (white-box) CLD analysis is found to be sensitive to non-uniform particle shape distributions, and to the artefacts introduced by the sensor itself. This is due to the physical basis of the transformation model and complicated by the non-trivial optimisation problem of finding the likely solution. In general, this method performs best with smaller particle sizes, but does not have an apparent trend with respect to concentration. The size dependency is understandable as our test materials for this method (polystyrene particles) are translucent and are therefore prone to chord splitting. The shape of the distribution should be preserved even at lower concentrations and the shape is important in the transformation (more so than raw count values). Low counts due to low concentration could yield noisier CLD, but this was not seen in our data (possibly due to large acquisition time making up for the low number of particles).
ML (black-box) CLD analysis yields improved results: output is very close to the ground truth (manufacturer specification, offline microscopy, or offline laser diffraction) but is limited by the training data: a much more varied training set is required for broader applicability.
Both white- and black-box approaches for image analysis show a similar trend in error with size: the largest (>30% of frame) and smallest (<10% of frame) particle sizes have higher error. This effect is shown for the ML approach on Figure 3 (a). This is due to resolution impacting measurement of small particles, while larger particles are less likely to be sampled at all. However, the white-box approach shows a trend in concentration: higher concentrations give higher error. This is not seen in the machine learning approach as the Mask-RCNN model is able to segment particles even in overlap (at least the particle in front, if not the background particle).
Conclusions
In this work we demonstrate a process for evaluation of in-line PAT through two in-line sensors, PVM and FBRM, each analysed using two techniques (a deterministic/white-box approach and a machine-learning/black box approach). These evaluations show trends for error with size and concentration. Image analysis has higher error for the largest particle sizes (> 30% of the frame) and smallest particle sizes (< 10% of the frame), for the PVM V819 sensor employed here. White-box CLD to PSD transformation has a strong reliance on size (directly proportional), but for our data shows no concentration dependence. This could inform the choice of using image analysis for middling sizes, and CLD transformation for small sizes. Larger particles may require the use of a larger imaging sensor, lesser magnification, or another in-line measurement technique not considered here.
Acknowledgements
This work was funded jointly by AstraZeneca, Bayer, Chiesi, Eli Lilly, GlaxoSmithKline, Novartis, Pfizer, Roche, Takeda, and UCB and was carried out within the CMAC Future Manufacturing Research Hub (Grant ref: EP/P006965/1). We are grateful to Francesca Perciballi (AstraZeneca), Neda Nazemifard (Takeda), Vaclav Svoboda (Pfizer), Chris Burcham (Eli Lilly), and Jan-Sebastiaan Uyttersprot (UCB) for project guidance.
References
Agimelen, O. S., Hamilton, P., Haley, I., Nordon, A., Vasile, M., Sefcik, J., and Mulholland, A. (2015) Estimate of particle size distribution and aspect ratio of non-spherical particles from chord length distribution. Chemical Engineering Science, 123: 629-640.
Cardona, J., Ferreira, C., McGinty, J., Hamilton, A., Agimelen, O. S., Cleary, A., Atkinson, R., Michie, C., Marshall, S., Chen, Y.-C., Sefcik, J., Andonovic, I., and Tachtatzis, C. (2018) Image analysis framework with focus evaluation for in-situ characterisation of particle size and shape attributes. Chemical Engineering Science, 191: 208-231.
He, K., Xiangyu Z., Shaoqing R., Jian S. (2015) Deep Residual Learning for Image Recognition. https://doi.org/10.48550/arXiv.1512.03385
He, K., Gkioxari, G., Dollár, P., Girshick, R. (2017) Mask R-CNN. IEEE International Conference on Computer Vision (ICCV). 2980-2988
Wu, Y., Kirillov, A., Massa, F., Lo, W.-Y., and Girshick, R. (2019) Detectron 2. https://github.com/facebookresearch/detectron2